< Home
WEEK 1. Introduction to Data Science and Exploration
NOVEMBER 18
ASSIGNMENT
- Select and document a data set to analyze
- Connect to a JupyterLab server and become familiar with the user interface.
DATASET
This dataset is the record of motor vehicle collision information from all police reported motor vehicle collisions in NYC.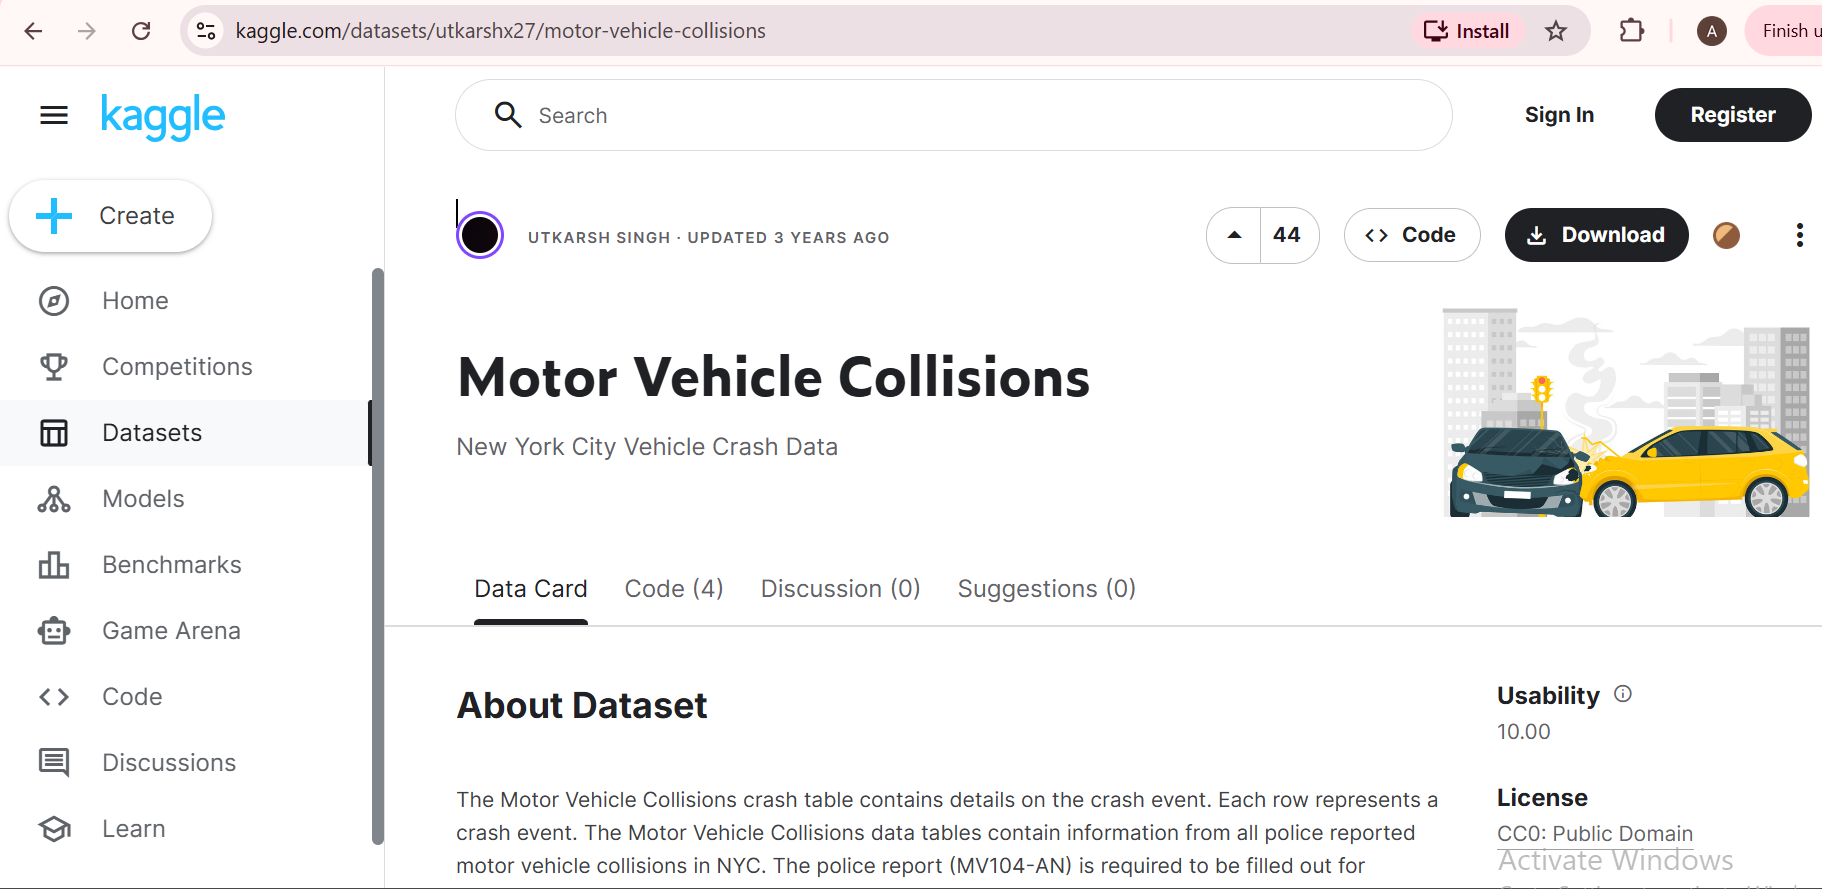
DATASET
Used codes to import the dataset to this pageimport pandas as pd
motor_vehicle = pd.read_csv("datasets/Motor_Vehicle_Collisions_-_Crashes.csv", low_memory=False)
motor_vehicle.head()
| CRASH DATE | CRASH TIME | BOROUGH | ZIP CODE | LATITUDE | LONGITUDE | LOCATION | ON STREET NAME | CROSS STREET NAME | OFF STREET NAME | ... | CONTRIBUTING FACTOR VEHICLE 2 | CONTRIBUTING FACTOR VEHICLE 3 | CONTRIBUTING FACTOR VEHICLE 4 | CONTRIBUTING FACTOR VEHICLE 5 | COLLISION_ID | VEHICLE TYPE CODE 1 | VEHICLE TYPE CODE 2 | VEHICLE TYPE CODE 3 | VEHICLE TYPE CODE 4 | VEHICLE TYPE CODE 5 | |
|---|---|---|---|---|---|---|---|---|---|---|---|---|---|---|---|---|---|---|---|---|---|
| 0 | 09/11/2021 | 2:39 | NaN | NaN | NaN | NaN | NaN | WHITESTONE EXPRESSWAY | 20 AVENUE | NaN | ... | Unspecified | NaN | NaN | NaN | 4455765 | Sedan | Sedan | NaN | NaN | NaN |
| 1 | 03/26/2022 | 11:45 | NaN | NaN | NaN | NaN | NaN | QUEENSBORO BRIDGE UPPER | NaN | NaN | ... | NaN | NaN | NaN | NaN | 4513547 | Sedan | NaN | NaN | NaN | NaN |
| 2 | 11/01/2023 | 1:29 | BROOKLYN | 11230 | 40.62179 | -73.970024 | (40.62179, -73.970024) | OCEAN PARKWAY | AVENUE K | NaN | ... | Unspecified | Unspecified | NaN | NaN | 4675373 | Moped | Sedan | Sedan | NaN | NaN |
| 3 | 06/29/2022 | 6:55 | NaN | NaN | NaN | NaN | NaN | THROGS NECK BRIDGE | NaN | NaN | ... | Unspecified | NaN | NaN | NaN | 4541903 | Sedan | Pick-up Truck | NaN | NaN | NaN |
| 4 | 09/21/2022 | 13:21 | NaN | NaN | NaN | NaN | NaN | BROOKLYN BRIDGE | NaN | NaN | ... | Unspecified | NaN | NaN | NaN | 4566131 | Station Wagon/Sport Utility Vehicle | NaN | NaN | NaN | NaN |
5 rows × 29 columns
motor_vehicle.tail()
| CRASH DATE | CRASH TIME | BOROUGH | ZIP CODE | LATITUDE | LONGITUDE | LOCATION | ON STREET NAME | CROSS STREET NAME | OFF STREET NAME | ... | CONTRIBUTING FACTOR VEHICLE 2 | CONTRIBUTING FACTOR VEHICLE 3 | CONTRIBUTING FACTOR VEHICLE 4 | CONTRIBUTING FACTOR VEHICLE 5 | COLLISION_ID | VEHICLE TYPE CODE 1 | VEHICLE TYPE CODE 2 | VEHICLE TYPE CODE 3 | VEHICLE TYPE CODE 4 | VEHICLE TYPE CODE 5 | |
|---|---|---|---|---|---|---|---|---|---|---|---|---|---|---|---|---|---|---|---|---|---|
| 2221554 | 11/16/2025 | 17:05 | BROOKLYN | 11235 | 40.588512 | -73.94935 | (40.588512, -73.94935) | AVENUE Z | OCEAN AVE | NaN | ... | Unspecified | NaN | NaN | NaN | 4857807 | Station Wagon/Sport Utility Vehicle | Station Wagon/Sport Utility Vehicle | NaN | NaN | NaN |
| 2221555 | 11/16/2025 | 9:40 | BROOKLYN | 11216 | 40.677650 | -73.94977 | (40.67765, -73.94977) | PACIFIC ST | NOSTRAND AVE | NaN | ... | Driver Inattention/Distraction | NaN | NaN | NaN | 4858253 | Sedan | NaN | NaN | NaN | NaN |
| 2221556 | 11/13/2025 | 21:30 | MANHATTAN | 10034 | 40.865100 | -73.92188 | (40.8651, -73.92188) | W 204 ST | SHERMAN AVE | NaN | ... | NaN | NaN | NaN | NaN | 4858271 | Sedan | NaN | NaN | NaN | NaN |
| 2221557 | 11/15/2025 | 2:45 | BRONX | 10457 | 40.844720 | -73.91227 | (40.84472, -73.91227) | E 174 ST | WALTON AVE | NaN | ... | NaN | NaN | NaN | NaN | 4858285 | Station Wagon/Sport Utility Vehicle | NaN | NaN | NaN | NaN |
| 2221558 | 11/16/2025 | 1:30 | QUEENS | 11419 | 40.684383 | -73.82326 | (40.684383, -73.82326) | 107 AVE | LEFFERTS BLVD | NaN | ... | Unspecified | NaN | NaN | NaN | 4857856 | Sedan | Station Wagon/Sport Utility Vehicle | NaN | NaN | NaN |
5 rows × 29 columns
import pandas as pd

df = pd.read_csv("datasets/Motor_Vehicle_Collisions_-_Crashes.csv", low_memory=False)
df.head(200)
- Juypter Lab Server
- Signed up and created an account.
- Public Website URL
- Accessed and explored the URL.
- Git Repository
Your Jupyter notebook URL: https://jupyter.fabcloud.org/user/adip-rai
Your public website URL: https://class.academany.org/futures/data-science/2025/labs/dgi/students/adip-rai/
Your project repository (on our git platform): https://gitlab.fabcloud.org/academany/futures/units/data-science/2025/labs/dgi/students/adip-rai/
Data Science Tools
Goal
The section outlines the tools that will be used in the Data Science curriculum — focusing on tools that support data analysis and computing workflows.Types of Tools

Specific Programming Languages and Environments


Packages and Libraries
NumPy – numerical computing
SciPy – scientific algorithms
scikit-learn – machine learning
ipywidgets – interactive UI elements
Matplotlib / Plotly / D3.js – visualization libraries
Git(version control)
Package managers like Conda for managing environments and dependencies
Data Science: Fitting
Core Learning Goals
Fit mathematical and statistical functions to real data – this includes understanding how a model (like a line or curve) can represent patterns in data.
Understand different modeling methods, such as simple linear trends, nonlinear fits, and more complex supervised learning models.
Use models to interpret and make predictions based on datasets, not just to visualize but to extract meaningful patterns. Fab Futures
Learn practical machine learning workflows, including evaluating how well fits or models perform on data.
Communicate results clearly with visualizations and explanations so that others can understand what the model shows.