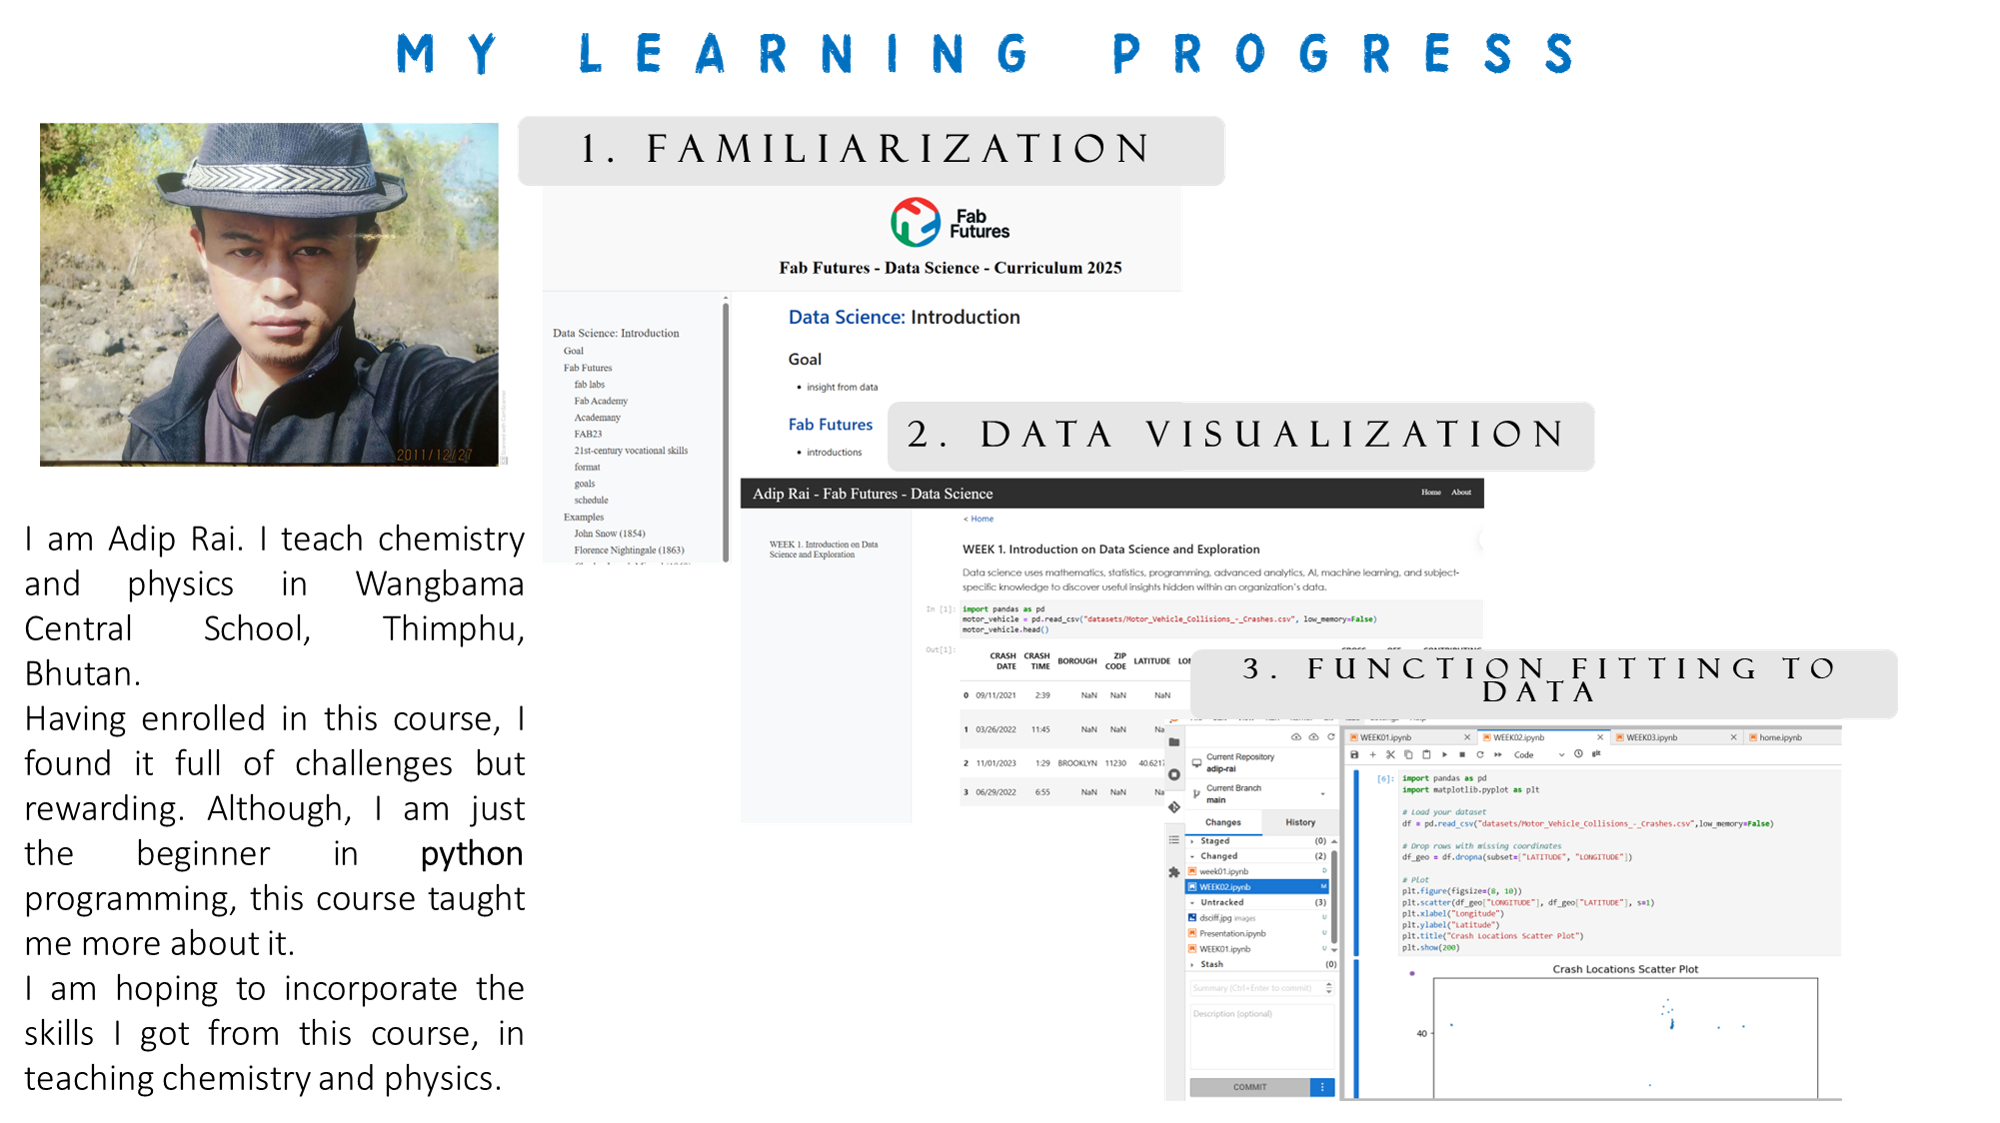
WEEK 03 - Probability
Goal
Probability distribution of your data
In [5]:
import pandas as pd
import matplotlib.pyplot as plt
from scipy.stats import norm
df = pd.read_csv("datasets/MotorVehicle_CrashRecord.csv")
df.head()
df["CRASH_HOUR"] = pd.to_datetime(df["CRASH TIME"], errors="coerce").dt.hour
df["CRASH_HOUR"].dropna().head()
plt.figure(figsize=(8, 5))
df["CRASH_HOUR"].plot(
    kind="hist",
    bins=24,
    density=True
)

plt.xlabel("Hour of Day")
plt.ylabel("Probability Density")
plt.title("Probability Distribution of Motor Vehicle Crashes by Hour")
plt.show()

injuries = df["NUMBER OF PERSONS INJURED"].dropna()

plt.figure(figsize=(8, 5))
plt.hist(injuries, bins=30, density=True)

plt.xlabel("Number of Persons Injured")
plt.ylabel("Probability Density")
plt.title("Probability Distribution of Number of Persons Injured")
plt.show()

mean = injuries.mean()
std = injuries.std()

x = injuries.sort_values()
plt.figure(figsize=(8, 5))
plt.hist(injuries, bins=30, density=True, alpha=0.6)
plt.plot(x, norm.pdf(x, mean, std))

plt.xlabel("Number of Persons Injured")
plt.ylabel("Probability Density")
plt.title("Injury Distribution vs Normal Distribution")
plt.show()
injuries.describe()
/tmp/ipykernel_477/2859588920.py:6: UserWarning: Could not infer format, so each element will be parsed individually, falling back to `dateutil`. To ensure parsing is consistent and as-expected, please specify a format.
  df["CRASH_HOUR"] = pd.to_datetime(df["CRASH TIME"], errors="coerce").dt.hour


Out[5]:
count    200.000000
mean       0.515000
std        0.789233
min        0.000000
25%        0.000000
50%        0.000000
75%        1.000000
max        4.000000
Name: NUMBER OF PERSONS INJURED, dtype: float64
Template notebook and slides
TASK: Create a notebook with the analysis of our data set (Currently need to make a dummy notebook for future work), store it in your repo, and call it presentation.ipynb
In [ ]: