MACHINE LEARNING

What is Machine Learning?
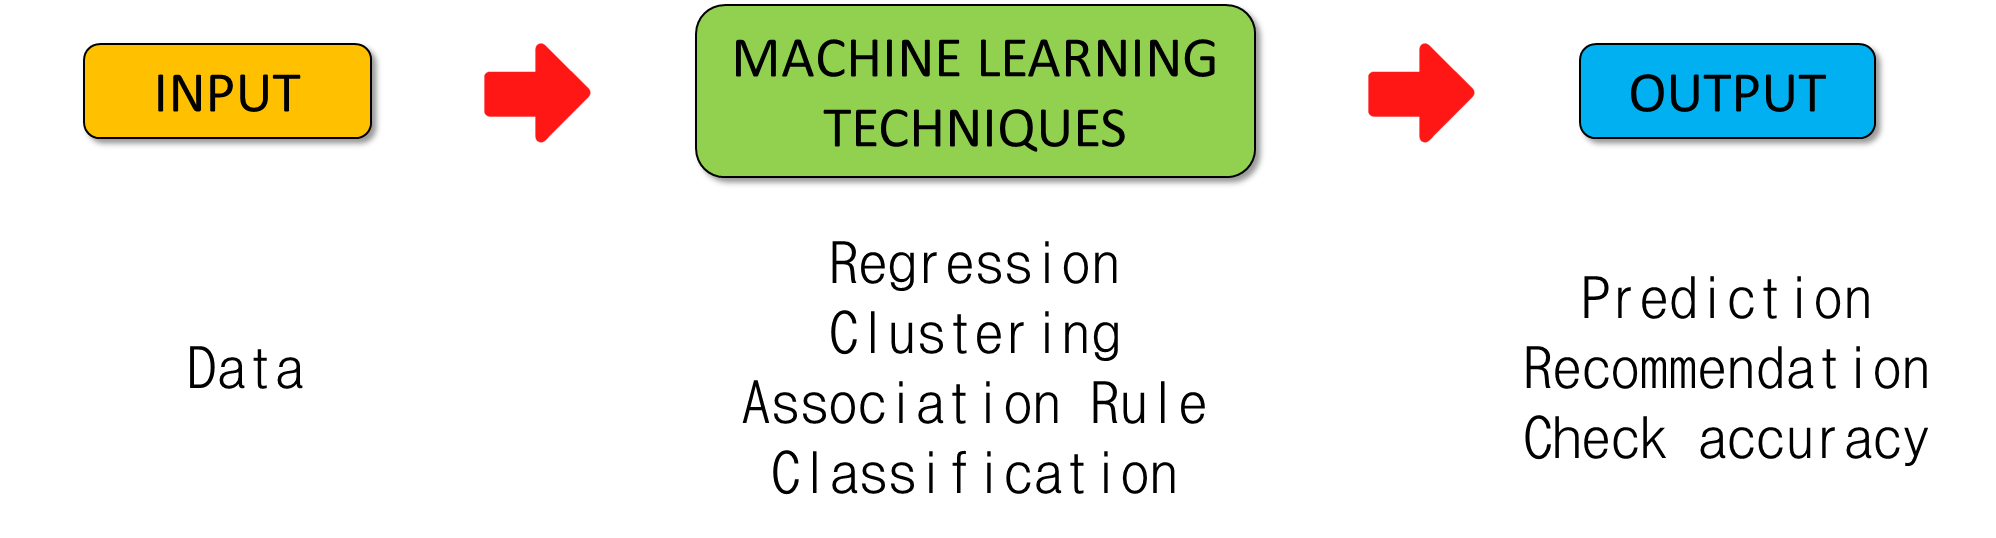
Machine learning is a branch of artificial intelligence that enables algorithms to uncover hidden patterns within datasets. It allows them to predict new, similar data without explicit programming for each task. Machine learning finds applications in diverse fields such as image and speech recognition, natural language processing, recommendation systems, fraud detection, portfolio optimization, and automating tasks.
https://www.geeksforgeeks.org/machine-learning/ml-machine-learning/
Since this field of data science is new to me, I explored various sources(websites) to fetch the simplest definition, and I got this simple definition from ChatGPT
Machine learning is a method in data science that uses data to train models so they can automatically learn, predict, or classify new information.
How Machine Learning Fits into Data Science
1. Imported the Required Libraries
In [4]:
import pandas as pd
import numpy as np
import matplotlib.pyplot as plt

from sklearn.model_selection import train_test_split
from sklearn.linear_model import LogisticRegression
from sklearn.metrics import accuracy_score, classification_report
2. Loaded the Dataset
In [5]:
df = pd.read_csv("datasets/MotorVehicle_CrashRecord.csv")
df.head(201)
Out[5]:
| CRASH DATE | CRASH TIME | BOROUGH | LATITUDE | LONGITUDE | ON STREET NAME | NUMBER OF PERSONS INJURED | NUMBER OF PERSONS KILLED | NUMBER OF PEDESTRIANS INJURED | NUMBER OF PEDESTRIANS KILLED | NUMBER OF CYCLIST INJURED | NUMBER OF CYCLIST KILLED | NUMBER OF MOTORIST INJURED | NUMBER OF MOTORIST KILLED | CONTRIBUTING FACTOR VEHICLE | VEHICLE TYPE CODE 1 | VEHICLE TYPE CODE 2 | VEHICLE TYPE CODE 3 | VEHICLE TYPE CODE 4 | VEHICLE TYPE CODE 5 | |
|---|---|---|---|---|---|---|---|---|---|---|---|---|---|---|---|---|---|---|---|---|
| 0 | 9/11/2021 | 2:39 | NaN | NaN | NaN | WHITESTONE EXPRESSWAY | 2 | 0 | 0 | 0 | 0 | 0 | 2 | 0 | Aggressive Driving/Road Rage | Sedan | Sedan | NaN | NaN | NaN |
| 1 | 3/26/2022 | 11:45 | NaN | NaN | NaN | QUEENSBORO BRIDGE UPPER | 1 | 0 | 0 | 0 | 0 | 0 | 1 | 0 | Pavement Slippery | Sedan | NaN | NaN | NaN | NaN |
| 2 | 11/1/2023 | 1:29 | BROOKLYN | 40.621790 | -73.970024 | OCEAN PARKWAY | 1 | 0 | 0 | 0 | 0 | 0 | 1 | 0 | Unspecified | Moped | Sedan | Sedan | NaN | NaN |
| 3 | 6/29/2022 | 6:55 | NaN | NaN | NaN | THROGS NECK BRIDGE | 0 | 0 | 0 | 0 | 0 | 0 | 0 | 0 | Following Too Closely | Sedan | Pick-up Truck | NaN | NaN | NaN |
| 4 | 9/21/2022 | 13:21 | NaN | NaN | NaN | BROOKLYN BRIDGE | 0 | 0 | 0 | 0 | 0 | 0 | 0 | 0 | Passing Too Closely | Station Wagon/Sport Utility Vehicle | NaN | NaN | NaN | NaN |
| ... | ... | ... | ... | ... | ... | ... | ... | ... | ... | ... | ... | ... | ... | ... | ... | ... | ... | ... | ... | ... |
| 195 | 3/23/2022 | 21:00 | QUEENS | 40.776764 | -73.848015 | NaN | 0 | 0 | 0 | 0 | 0 | 0 | 0 | 0 | Unspecified | Sedan | NaN | NaN | NaN | NaN |
| 196 | 3/26/2022 | 12:00 | QUEENS | 40.747498 | -73.913090 | NaN | 0 | 0 | 0 | 0 | 0 | 0 | 0 | 0 | Unspecified | Sedan | NaN | NaN | NaN | NaN |
| 197 | 3/26/2022 | 13:28 | BROOKLYN | 40.701637 | -73.942276 | GRAHAM AVENUE | 1 | 0 | 0 | 0 | 0 | 0 | 1 | 0 | Following Too Closely | Station Wagon/Sport Utility Vehicle | Station Wagon/Sport Utility Vehicle | NaN | NaN | NaN |
| 198 | 3/26/2022 | 19:12 | QUEENS | 40.693490 | -73.826546 | NaN | 0 | 0 | 0 | 0 | 0 | 0 | 0 | 0 | Unsafe Speed | Station Wagon/Sport Utility Vehicle | Sedan | NaN | NaN | NaN |
| 199 | 3/26/2022 | 21:29 | QUEENS | 40.726463 | -73.859430 | WETHEROLE STREET | 1 | 0 | 1 | 0 | 0 | 0 | 0 | 0 | Unsafe Speed | Bike | NaN | NaN | NaN | NaN |
200 rows × 20 columns
In [6]:
df.columns
Out[6]:
Index(['CRASH DATE', 'CRASH TIME', 'BOROUGH', 'LATITUDE', 'LONGITUDE',
       'ON STREET NAME', 'NUMBER OF PERSONS INJURED',
       'NUMBER OF PERSONS KILLED', 'NUMBER OF PEDESTRIANS INJURED',
       'NUMBER OF PEDESTRIANS KILLED', 'NUMBER OF CYCLIST INJURED',
       'NUMBER OF CYCLIST KILLED', 'NUMBER OF MOTORIST INJURED',
       'NUMBER OF MOTORIST KILLED', 'CONTRIBUTING FACTOR VEHICLE',
       'VEHICLE TYPE CODE 1', 'VEHICLE TYPE CODE 2', 'VEHICLE TYPE CODE 3',
       'VEHICLE TYPE CODE 4', 'VEHICLE TYPE CODE 5'],
      dtype='object')
3. Create a target variable (Label)
In [7]:
df = df[[
    "LATITUDE",
    "LONGITUDE",
    "CONTRIBUTING FACTOR VEHICLE"
]]
In [8]:
df.head(201)
Out[8]:
| LATITUDE | LONGITUDE | CONTRIBUTING FACTOR VEHICLE | |
|---|---|---|---|
| 0 | NaN | NaN | Aggressive Driving/Road Rage |
| 1 | NaN | NaN | Pavement Slippery |
| 2 | 40.621790 | -73.970024 | Unspecified |
| 3 | NaN | NaN | Following Too Closely |
| 4 | NaN | NaN | Passing Too Closely |
| ... | ... | ... | ... |
| 195 | 40.776764 | -73.848015 | Unspecified |
| 196 | 40.747498 | -73.913090 | Unspecified |
| 197 | 40.701637 | -73.942276 | Following Too Closely |
| 198 | 40.693490 | -73.826546 | Unsafe Speed |
| 199 | 40.726463 | -73.859430 | Unsafe Speed |
200 rows × 3 columns
In [9]:
# Remove rows with missing latitude or longitude
df = df.dropna(subset=["LATITUDE", "LONGITUDE"])

# Replace missing or unspecified factors
df["CONTRIBUTING FACTOR VEHICLE"] = df["CONTRIBUTING FACTOR VEHICLE"].fillna("Unknown")
5. Define the target variable
We convert contributing factor into:
1 → Driver-related causes
0 → Other causes
In [10]:
driver_factors = [
    "Aggressive Driving/Road Rage",
    "Pavement Slippery",
    "Unspecified",
    "Following Too Closely",
    "Passing Too Closely",
    "Failure to Yield Right-of-Way",
    "Driver Inexperience",
    "Passing or Lane Usage Improper",
    "Turning Improperly",
    "Unsafe Lane Changing",
    "Unsafe Speed",
    "Reaction to Uninvolved Vehicle",
    "Steering Failure",
    "Traffic Control Disregarded",
    "Other Vehicular",
    "Driver Inattention/Distraction",
    "Accelerator Defective",
    "Oversized Vehicle",
    "Pedestrian/Bicyclist/Other Pedestrian Error/Confusion",
    "Alcohol Involvement",
    "View Obstructed/Limited",
    "Illness",
    "Lost Consciousness",
    "Brakes Defective",
    "Backing Unsafely",
    "Glare",
    "Passenger Distraction",
    "Fell Asleep"
]

df["DRIVER_FAULT"] = df["CONTRIBUTING FACTOR VEHICLE"].apply(
    lambda x: 1 if x in driver_factors else 0
)
6. Define features (X) and target (y)
In [11]:
X = df[["LATITUDE", "LONGITUDE", "CONTRIBUTING FACTOR VEHICLE"]]
y = df["DRIVER_FAULT"]
7. Convert categorical column to numeric
In [12]:
X = pd.get_dummies(X, drop_first=True)
8. Train Test Split
In [13]:
X_train, X_test, y_train, y_test = train_test_split(
    X, y, test_size=0.2, random_state=42
)
9. Train the Model
In [14]:
model = LogisticRegression(max_iter=1000)
model.fit(X_train, y_train)
Out[14]:
LogisticRegression(max_iter=1000)In a Jupyter environment, please rerun this cell to show the HTML representation or trust the notebook.
On GitHub, the HTML representation is unable to render, please try loading this page with nbviewer.org.
Parameters
| penalty | 'l2' | |
| dual | False | |
| tol | 0.0001 | |
| C | 1.0 | |
| fit_intercept | True | |
| intercept_scaling | 1 | |
| class_weight | None | |
| random_state | None | |
| solver | 'lbfgs' | |
| max_iter | 1000 | |
| multi_class | 'deprecated' | |
| verbose | 0 | |
| warm_start | False | |
| n_jobs | None | |
| l1_ratio | None |
10. Make predictions and check accuracy
In [15]:
y_pred = model.predict(X_test)
print("Accuracy:", accuracy_score(y_test, y_pred))
Accuracy: 1.0
In [16]:
print(y_pred)
[1 1 1 1 1 1 1 1 1 1 1 1 1 1 1 1 1 1 1 1 1 1 1 1 1 1 1 1 1 1 1 1 1 1]
In [17]:
results = pd.DataFrame({
    "Actual": y_test.values,
    "Predicted": y_pred
})

results.head(10)
Out[17]:
| Actual | Predicted | |
|---|---|---|
| 0 | 1 | 1 |
| 1 | 1 | 1 |
| 2 | 1 | 1 |
| 3 | 1 | 1 |
| 4 | 1 | 1 |
| 5 | 1 | 1 |
| 6 | 1 | 1 |
| 7 | 1 | 1 |
| 8 | 1 | 1 |
| 9 | 1 | 1 |
In [18]:
from sklearn.metrics import confusion_matrix

print(confusion_matrix(y_test, y_pred))
[[34]]
/opt/conda/lib/python3.13/site-packages/sklearn/metrics/_classification.py:534: UserWarning: A single label was found in 'y_true' and 'y_pred'. For the confusion matrix to have the correct shape, use the 'labels' parameter to pass all known labels.
  warnings.warn(