Density Estimation
Density estimation in data science is about figuring out how data is distributed.
It answers questions like:
Where are data points concentrated?
What values are most likely?
Is the distribution skewed, multimodal, or spread out?
1. Understand the Data
In [3]:
import pandas as pd

# Load the dataset
df = pd.read_csv("datasets/MotorVehicle_CrashRecord.csv")

# Inspect the first few rows
print(df.head())

# Check the columns and data types
print(df.info())
  CRASH DATE CRASH TIME   BOROUGH  LATITUDE  LONGITUDE  \
0  9/11/2021       2:39       NaN       NaN        NaN
1  3/26/2022      11:45       NaN       NaN        NaN
2  11/1/2023       1:29  BROOKLYN  40.62179 -73.970024
3  6/29/2022       6:55       NaN       NaN        NaN
4  9/21/2022      13:21       NaN       NaN        NaN

            ON STREET NAME  NUMBER OF PERSONS INJURED  \
0    WHITESTONE EXPRESSWAY                          2
1  QUEENSBORO BRIDGE UPPER                          1
2            OCEAN PARKWAY                          1
3       THROGS NECK BRIDGE                          0
4          BROOKLYN BRIDGE                          0

   NUMBER OF PERSONS KILLED  NUMBER OF PEDESTRIANS INJURED  \
0                         0                              0
1                         0                              0
2                         0                              0
3                         0                              0
4                         0                              0

   NUMBER OF PEDESTRIANS KILLED  NUMBER OF CYCLIST INJURED  \
0                             0                          0
1                             0                          0
2                             0                          0
3                             0                          0
4                             0                          0

   NUMBER OF CYCLIST KILLED  NUMBER OF MOTORIST INJURED  \
0                         0                           2
1                         0                           1
2                         0                           1
3                         0                           0
4                         0                           0

   NUMBER OF MOTORIST KILLED   CONTRIBUTING FACTOR VEHICLE  \
0                          0  Aggressive Driving/Road Rage
1                          0             Pavement Slippery
2                          0                   Unspecified
3                          0         Following Too Closely
4                          0           Passing Too Closely

                   VEHICLE TYPE CODE 1 VEHICLE TYPE CODE 2  \
0                                Sedan               Sedan
1                                Sedan                 NaN
2                                Moped               Sedan
3                                Sedan       Pick-up Truck
4  Station Wagon/Sport Utility Vehicle                 NaN

  VEHICLE TYPE CODE 3 VEHICLE TYPE CODE 4  VEHICLE TYPE CODE 5
0                 NaN                 NaN                  NaN
1                 NaN                 NaN                  NaN
2               Sedan                 NaN                  NaN
3                 NaN                 NaN                  NaN
4                 NaN                 NaN                  NaN
<class 'pandas.core.frame.DataFrame'>
RangeIndex: 200 entries, 0 to 199
Data columns (total 20 columns):
 #   Column                         Non-Null Count  Dtype
---  ------                         --------------  -----
 0   CRASH DATE                     200 non-null    object
 1   CRASH TIME                     200 non-null    object
 2   BOROUGH                        124 non-null    object
 3   LATITUDE                       169 non-null    float64
 4   LONGITUDE                      169 non-null    float64
 5   ON STREET NAME                 151 non-null    object
 6   NUMBER OF PERSONS INJURED      200 non-null    int64
 7   NUMBER OF PERSONS KILLED       200 non-null    int64
 8   NUMBER OF PEDESTRIANS INJURED  200 non-null    int64
 9   NUMBER OF PEDESTRIANS KILLED   200 non-null    int64
 10  NUMBER OF CYCLIST INJURED      200 non-null    int64
 11  NUMBER OF CYCLIST KILLED       200 non-null    int64
 12  NUMBER OF MOTORIST INJURED     200 non-null    int64
 13  NUMBER OF MOTORIST KILLED      200 non-null    int64
 14  CONTRIBUTING FACTOR VEHICLE    198 non-null    object
 15  VEHICLE TYPE CODE 1            196 non-null    object
 16  VEHICLE TYPE CODE 2            123 non-null    object
 17  VEHICLE TYPE CODE 3            11 non-null     object
 18  VEHICLE TYPE CODE 4            3 non-null      object
 19  VEHICLE TYPE CODE 5            0 non-null      float64
dtypes: float64(3), int64(8), object(9)
memory usage: 31.4+ KB
None
2. Choose a Feature for Density Estimation
Example: estimate density for Hour to find high-risk hours.
3. Use Kernel Density Estimation (KDE)
In [4]:
import seaborn as sns
import matplotlib.pyplot as plt

# Plot KDE for 'Hour' column
sns.kdeplot(df['Hour'], bw_adjust=0.5)  # bw_adjust controls smoothness
plt.xlabel('Hour of Day')
plt.ylabel('Density')
plt.title('Density Estimation of Accidents by Hour')
plt.show()
---------------------------------------------------------------------------
KeyError                                  Traceback (most recent call last)
File /opt/conda/lib/python3.13/site-packages/pandas/core/indexes/base.py:3812, in Index.get_loc(self, key)
   3811 try:
-> 3812     return self._engine.get_loc(casted_key)
   3813 except KeyError as err:

File pandas/_libs/index.pyx:167, in pandas._libs.index.IndexEngine.get_loc()

File pandas/_libs/index.pyx:196, in pandas._libs.index.IndexEngine.get_loc()

File pandas/_libs/hashtable_class_helper.pxi:7088, in pandas._libs.hashtable.PyObjectHashTable.get_item()

File pandas/_libs/hashtable_class_helper.pxi:7096, in pandas._libs.hashtable.PyObjectHashTable.get_item()

KeyError: 'Hour'

The above exception was the direct cause of the following exception:

KeyError                                  Traceback (most recent call last)
Cell In[4], line 5
      2 import matplotlib.pyplot as plt
      4 # Plot KDE for 'Hour' column
----> 5 sns.kdeplot(df['Hour'], bw_adjust=0.5)  # bw_adjust controls smoothness
      6 plt.xlabel('Hour of Day')
      7 plt.ylabel('Density')

File /opt/conda/lib/python3.13/site-packages/pandas/core/frame.py:4113, in DataFrame.__getitem__(self, key)
   4111 if self.columns.nlevels > 1:
   4112     return self._getitem_multilevel(key)
-> 4113 indexer = self.columns.get_loc(key)
   4114 if is_integer(indexer):
   4115     indexer = [indexer]

File /opt/conda/lib/python3.13/site-packages/pandas/core/indexes/base.py:3819, in Index.get_loc(self, key)
   3814     if isinstance(casted_key, slice) or (
   3815         isinstance(casted_key, abc.Iterable)
   3816         and any(isinstance(x, slice) for x in casted_key)
   3817     ):
   3818         raise InvalidIndexError(key)
-> 3819     raise KeyError(key) from err
   3820 except TypeError:
   3821     # If we have a listlike key, _check_indexing_error will raise
   3822     #  InvalidIndexError. Otherwise we fall through and re-raise
   3823     #  the TypeError.
   3824     self._check_indexing_error(key)

KeyError: 'Hour'
Density Estimation
In [10]:
borough_density = df['Borough'].value_counts(normalize=True)
print(borough_density)

# Optional: visualize
borough_density.plot(kind='bar', color='skyblue')
plt.ylabel('Probability')
plt.title('Accident Density by Borough')
plt.show()
---------------------------------------------------------------------------
KeyError                                  Traceback (most recent call last)
File /opt/conda/lib/python3.13/site-packages/pandas/core/indexes/base.py:3812, in Index.get_loc(self, key)
   3811 try:
-> 3812     return self._engine.get_loc(casted_key)
   3813 except KeyError as err:

File pandas/_libs/index.pyx:167, in pandas._libs.index.IndexEngine.get_loc()

File pandas/_libs/index.pyx:196, in pandas._libs.index.IndexEngine.get_loc()

File pandas/_libs/hashtable_class_helper.pxi:7088, in pandas._libs.hashtable.PyObjectHashTable.get_item()

File pandas/_libs/hashtable_class_helper.pxi:7096, in pandas._libs.hashtable.PyObjectHashTable.get_item()

KeyError: 'Borough'

The above exception was the direct cause of the following exception:

KeyError                                  Traceback (most recent call last)
Cell In[10], line 1
----> 1 borough_density = df['Borough'].value_counts(normalize=True)
      2 print(borough_density)
      4 # Optional: visualize

File /opt/conda/lib/python3.13/site-packages/pandas/core/frame.py:4113, in DataFrame.__getitem__(self, key)
   4111 if self.columns.nlevels > 1:
   4112     return self._getitem_multilevel(key)
-> 4113 indexer = self.columns.get_loc(key)
   4114 if is_integer(indexer):
   4115     indexer = [indexer]

File /opt/conda/lib/python3.13/site-packages/pandas/core/indexes/base.py:3819, in Index.get_loc(self, key)
   3814     if isinstance(casted_key, slice) or (
   3815         isinstance(casted_key, abc.Iterable)
   3816         and any(isinstance(x, slice) for x in casted_key)
   3817     ):
   3818         raise InvalidIndexError(key)
-> 3819     raise KeyError(key) from err
   3820 except TypeError:
   3821     # If we have a listlike key, _check_indexing_error will raise
   3822     #  InvalidIndexError. Otherwise we fall through and re-raise
   3823     #  the TypeError.
   3824     self._check_indexing_error(key)

KeyError: 'Borough'
In [8]:
df['Hour'] = pd.to_numeric(df['Hour'], errors='coerce')  # convert to numeric, invalids become NaN
hour_data = df['Hour'].dropna()
---------------------------------------------------------------------------
KeyError                                  Traceback (most recent call last)
File /opt/conda/lib/python3.13/site-packages/pandas/core/indexes/base.py:3812, in Index.get_loc(self, key)
   3811 try:
-> 3812     return self._engine.get_loc(casted_key)
   3813 except KeyError as err:

File pandas/_libs/index.pyx:167, in pandas._libs.index.IndexEngine.get_loc()

File pandas/_libs/index.pyx:196, in pandas._libs.index.IndexEngine.get_loc()

File pandas/_libs/hashtable_class_helper.pxi:7088, in pandas._libs.hashtable.PyObjectHashTable.get_item()

File pandas/_libs/hashtable_class_helper.pxi:7096, in pandas._libs.hashtable.PyObjectHashTable.get_item()

KeyError: 'Hour'

The above exception was the direct cause of the following exception:

KeyError                                  Traceback (most recent call last)
Cell In[8], line 1
----> 1 df['Hour'] = pd.to_numeric(df['Hour'], errors='coerce')  # convert to numeric, invalids become NaN
      2 hour_data = df['Hour'].dropna()

File /opt/conda/lib/python3.13/site-packages/pandas/core/frame.py:4113, in DataFrame.__getitem__(self, key)
   4111 if self.columns.nlevels > 1:
   4112     return self._getitem_multilevel(key)
-> 4113 indexer = self.columns.get_loc(key)
   4114 if is_integer(indexer):
   4115     indexer = [indexer]

File /opt/conda/lib/python3.13/site-packages/pandas/core/indexes/base.py:3819, in Index.get_loc(self, key)
   3814     if isinstance(casted_key, slice) or (
   3815         isinstance(casted_key, abc.Iterable)
   3816         and any(isinstance(x, slice) for x in casted_key)
   3817     ):
   3818         raise InvalidIndexError(key)
-> 3819     raise KeyError(key) from err
   3820 except TypeError:
   3821     # If we have a listlike key, _check_indexing_error will raise
   3822     #  InvalidIndexError. Otherwise we fall through and re-raise
   3823     #  the TypeError.
   3824     self._check_indexing_error(key)

KeyError: 'Hour'
In [5]:
print(df['Hour'].head())
print(df['Hour'].dtype)
print(df['Hour'].isna().sum())
---------------------------------------------------------------------------
KeyError                                  Traceback (most recent call last)
File /opt/conda/lib/python3.13/site-packages/pandas/core/indexes/base.py:3812, in Index.get_loc(self, key)
   3811 try:
-> 3812     return self._engine.get_loc(casted_key)
   3813 except KeyError as err:

File pandas/_libs/index.pyx:167, in pandas._libs.index.IndexEngine.get_loc()

File pandas/_libs/index.pyx:196, in pandas._libs.index.IndexEngine.get_loc()

File pandas/_libs/hashtable_class_helper.pxi:7088, in pandas._libs.hashtable.PyObjectHashTable.get_item()

File pandas/_libs/hashtable_class_helper.pxi:7096, in pandas._libs.hashtable.PyObjectHashTable.get_item()

KeyError: 'Hour'

The above exception was the direct cause of the following exception:

KeyError                                  Traceback (most recent call last)
Cell In[5], line 1
----> 1 print(df['Hour'].head())
      2 print(df['Hour'].dtype)
      3 print(df['Hour'].isna().sum())

File /opt/conda/lib/python3.13/site-packages/pandas/core/frame.py:4113, in DataFrame.__getitem__(self, key)
   4111 if self.columns.nlevels > 1:
   4112     return self._getitem_multilevel(key)
-> 4113 indexer = self.columns.get_loc(key)
   4114 if is_integer(indexer):
   4115     indexer = [indexer]

File /opt/conda/lib/python3.13/site-packages/pandas/core/indexes/base.py:3819, in Index.get_loc(self, key)
   3814     if isinstance(casted_key, slice) or (
   3815         isinstance(casted_key, abc.Iterable)
   3816         and any(isinstance(x, slice) for x in casted_key)
   3817     ):
   3818         raise InvalidIndexError(key)
-> 3819     raise KeyError(key) from err
   3820 except TypeError:
   3821     # If we have a listlike key, _check_indexing_error will raise
   3822     #  InvalidIndexError. Otherwise we fall through and re-raise
   3823     #  the TypeError.
   3824     self._check_indexing_error(key)

KeyError: 'Hour'
In [9]:
import seaborn as sns
import matplotlib.pyplot as plt

sns.kdeplot(hour_data, bw_adjust=0.5)
plt.xlabel('Hour of Day')
plt.ylabel('Density')
plt.title('Density Estimation of Accidents by Hour')
plt.show()
---------------------------------------------------------------------------
NameError                                 Traceback (most recent call last)
Cell In[9], line 4
      1 import seaborn as sns
      2 import matplotlib.pyplot as plt
----> 4 sns.kdeplot(hour_data, bw_adjust=0.5)
      5 plt.xlabel('Hour of Day')
      6 plt.ylabel('Density')

NameError: name 'hour_data' is not defined
Got overwhelming errors and tried so many ways, but in vain.
I sought the help of ChatGPT and then I could atleast represent the data in 'Density Estimation' and 'Kernel Density Estimation'.
In [5]:
import pandas as pd
import matplotlib.pyplot as plt
df = pd.read_csv("datasets/MotorVehicle_CrashRecord.csv")
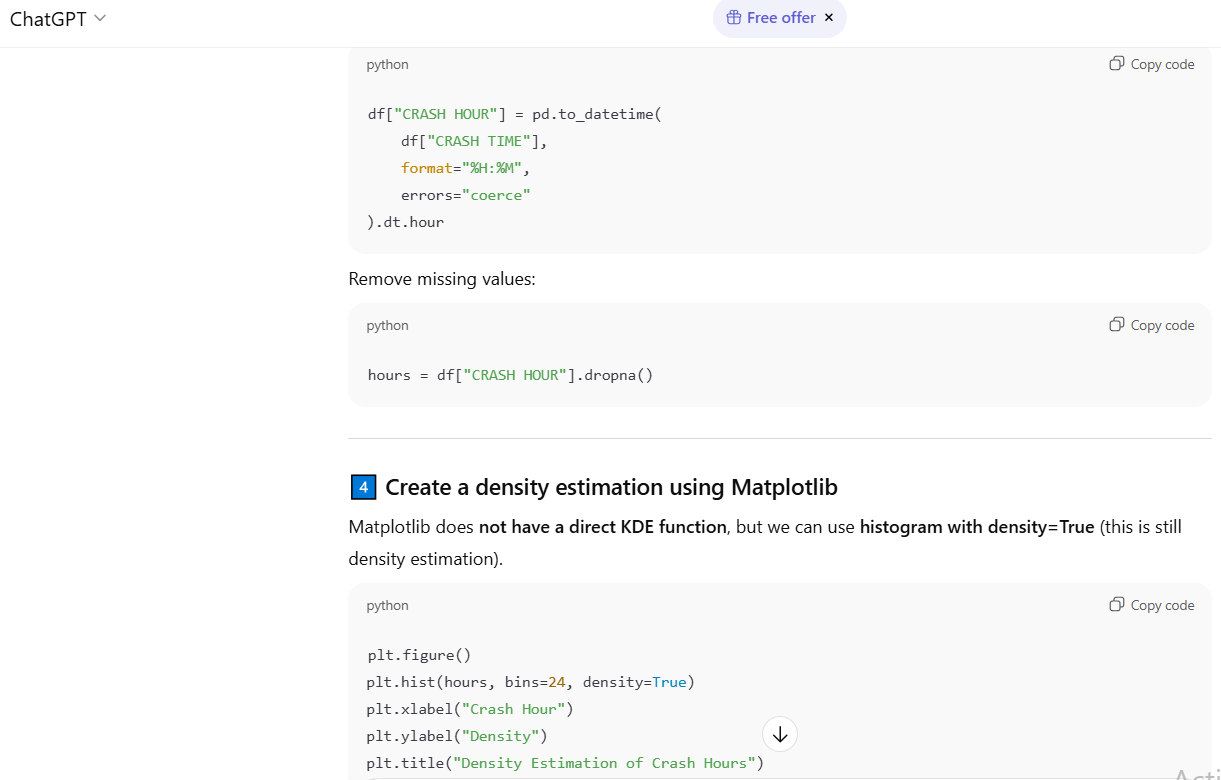
df["CRASH HOUR"] = pd.to_datetime(
df["CRASH TIME"],
format="%H:%M",
errors="coerce"
).dt.hour
hours = df["CRASH HOUR"].dropna()
plt.figure()
plt.hist(hours, bins=24, density=True)
plt.xlabel("Crash Hour")
plt.ylabel("Density")
plt.title("Density Estimation of Crash Hours")
plt.show()
from scipy.stats import gaussian_kde
import numpy as np
kde = gaussian_kde(hours)
x = np.linspace(0, 23, 200)
plt.figure()
plt.plot(x, kde(x))
plt.xlabel("Crash Hour")
plt.ylabel("Density")
plt.title("Kernel Density Estimation of Crash Hours")
plt.show()


In [ ]: