Fitting a machine learning model
In case anyone going through this doesn't have the patience to read through everything ... a remaining question I have that I think would really help my understanding of this assignment in particular is at the bottom of this notebook.
To better understand this assignment, I put the following prompt into Gemini: What does it mean to fit a machine learning model to this data? What would it mean to fit one to this data?
This was the given response:
To "fit" a machine learning model to your data means to tailor a mathematical rule until it matches your history as closely as possible. Think of it like tailoring a suit:
- The Body: Your actual data (the black dots: deaths in 2018, 2019, etc.).
- The Suit: The mathematical function (the line or curve).
- "Fitting": The process of measuring, pinning, and cutting the suit so it matches the shape of the body perfectly.
What it means specifically for your Bhutan Data When you run that code to "fit" a model to the Infectious Diseases category, you are asking the computer to answer three questions:
- The Learning Phase (The "Fit") The computer looks at your 5 data points and asks: "What simple math rule could explain these numbers?"
- The Result (The Model) Once the "fitting" is done, you no longer just have 5 random numbers. You have a Trend. You have captured the "essence" of what is happening to Infectious Diseases in Bhutan.
- The Purpose (Prediction) Because you "fit" the model to the past, you assume the suit will still fit next year.
In your Bhutan project:
- Input: The Year (e.g., 2024).
- The Model: The mathematical formula (the curve or line).
- Output: The Number of Deaths.
I was very unclear on the meaning of a machine learning model in the context of my data - a big big thank you to Rico san and Anith for their documentation and the breakdown of Neil's code, which gave me a better (theoretical) understanding of Neural Networks, training models on data, etc. It became clearer through this reading that MLPClassifier/scikit-learn would be more useful for me, since I am a total beginner.
However, I still do not feel confident at all with regards to what a machine learning model is - although their documentation made sense, I know that I have not understood it because 1) it took a lot of prompts to make sense of what it means for my data, and 2) I still don't know what questions to ask.
To make an attempt at the assignment anyways, I asked Gemini the following two questions:
- What data would I use to train a machine learning model, given the data I already have?
- How can I apply MLPClassifier to the data I have? Please provide an explanation on the theory first.
The response from Gemini + some of my other notes are here.
import pandas as pd
import numpy as np
# Loading my file
df = pd.read_csv("datasets/Mortality cases3.csv")
df.head(5)
| ICD10 CODE | Name of the Disease | Type of disease | 2018 | 2019 | 2020 | 2021 | 2022 | |
|---|---|---|---|---|---|---|---|---|
| 0 | A02ᴳ | Diarrhoea | Infectious | 6.0 | 6.0 | 2.0 | NaN | 2.0 |
| 1 | A03ᴳ | Dysentery | Infectious | NaN | NaN | NaN | NaN | NaN |
| 2 | A15ᴳ | Tuberculosis | Infectious | 22.0 | 20.0 | 20.0 | 31.0 | 17.0 |
| 3 | A41ᴳ | Other Sepsis, including Septicaemia | Infectious | 62.0 | 46.0 | 52.0 | 32.0 | 45.0 |
| 4 | A50 | Congenital Syphilis | Infectious | NaN | NaN | NaN | NaN | NaN |
# Variable for grouping my data
years = ['2018', '2019', '2020', '2021', '2022']

# Trimming whitespace:
df['Type of disease'] = df['Type of disease'].str.strip()

# Editing my data since some of the categories became confusing to work with:
df['Type of disease'] = df['Type of disease'].replace('Infectious', 'Infectious Diseases')

# New table! Grouping my data by the preferred category and summing the years for total deaths per category per year
df_grouped = df.groupby('Type of disease')[years].sum() #This is from Gemini
from sklearn.neural_network import MLPRegressor # "Regressor" is used because I want to predict a number (deaths), not a category (cat/dog).
from sklearn.preprocessing import MinMaxScaler # Neural networks are bad at understanding big years like "2022," but good at understanding small numbers like "0.5." This tool squashes our data down to a range of 0 to 1.
import numpy as np
import plotly.graph_objects as go

def analyse_neural_network(category_name):
    # 1. PREPARING DATA - the same "safety check" as I used before
    if category_name not in df_grouped.index:
        return
    y_values = df_grouped.loc[category_name].values # The "Answers." The actual death counts from your file.
    x_values = np.array([2018, 2019, 2020, 2021, 2022]) # The "Questions." The years.

    # 2. FORMATTING (Crucial for Neural Networks)
    # Scikit-learn needs data shaped like vertical columns [[2018], [2019]...]
    X_train = x_values.reshape(-1, 1) #reshape(-1, 1) turns the list of years from a horizontal Row [2018, 2019...] into a vertical Column [[2018], [2019]...] as necessitated by scikit
    y_train = y_values

    # Scaling: Neural Networks hate big numbers like "2022", so they are "squashed" between 0 and 1.
    # The following code looks at my data - 2018 is the smallest (Min) and 2022 is the largest (Max).
    # Transform: It converts 2018 to 0.0, 2022 to 1.0, and everything else in between.
    # Without this, the Neural Network tries to do math with "2,022"

    scaler = MinMaxScaler()
    X_scaled = scaler.fit_transform(X_train)

    # 3. CREATING THE BRAIN (MLPRegressor)
    # hidden_layer_sizes=(100,): A brain with 100 neurons
    # max_iter=2000: Try to learn 2000 times

    # What I found interesting was that a warning was returned here - more on that will be discussed below

    model = MLPRegressor(hidden_layer_sizes=(100,), max_iter=10000, random_state=42)

        # hidden_layer_sizes=(100,): Creates a "brain" with 100 neurons working together to find the pattern.
        # max_iter=2000: "Maximum Iterations." It tells the model: "You are allowed to look at the data and adjust your thinking 2,000 times. If you haven't figured it out by then, stop anyway."
        # STILL CONFUSED ABOUT THIS PART random_state=42: Neural networks start with random guesses. Setting this to 42 ensures that the randomness is consistent.

    # 4. TRAINING (Fit)
    model.fit(X_scaled, y_train)

        # This is the most amazing but obscure part to me -
        # .fit(...): The model takes the translated questions (X_scaled) and the real answers (y_train) and studies them. It adjusts the neurons until it finds a mathematical formula that connects 0.0 to 50, 0.25 to 55, etc.

    # 5. PREDICTING
    # Let's predict for 2018-2023
    x_future = np.array([[2018], [2019], [2020], [2021], [2022], [2023]])
    x_future_scaled = scaler.transform(x_future)
    # scaler.transform is a crucial step, as the model only speaks the "0 to 1" language.
    predictions = model.predict(x_future_scaled)
    # Now that the years are translated, the model applies the pattern it learned and shows the predicted death counts

    # 6. VISUALISING - creates the blank chart
    fig = go.Figure()

    # Real Data - plots the "Real History" as black dots.
    fig.add_trace(go.Scatter(x=x_values, y=y_values, mode='markers', name='Actual Data',
                             marker=dict(color='black', size=12)))

    # Neural Network Prediction
    # x_future.flatten(): plotly prefers a Row rather than a column. .flatten() "undoes" the reshape so we can draw the line easily.
    # y=predictions: Plots the blue line showing what the Neural Network thinks happened (and will happen)
    fig.add_trace(go.Scatter(x=x_future.flatten(), y=predictions, mode='lines', name='Neural Network Fit',
                             line=dict(color='blue', width=3)))

    fig.update_layout(title=f"Applying the Neural Network: {category_name}")
    fig.show()

# Run it
analyse_neural_network('Infectious Diseases')

In the code I'd originally gotten from Gemini, this warning showed:
/opt/conda/lib/python3.13/site-packages/sklearn/neural_network/_multilayer_perceptron.py:781: ConvergenceWarning: Stochastic Optimizer: Maximum iterations (2000) reached and the optimization hasn't converged yet.
I tried out a few different iterations to see what number of iterations would no longer show a warning.
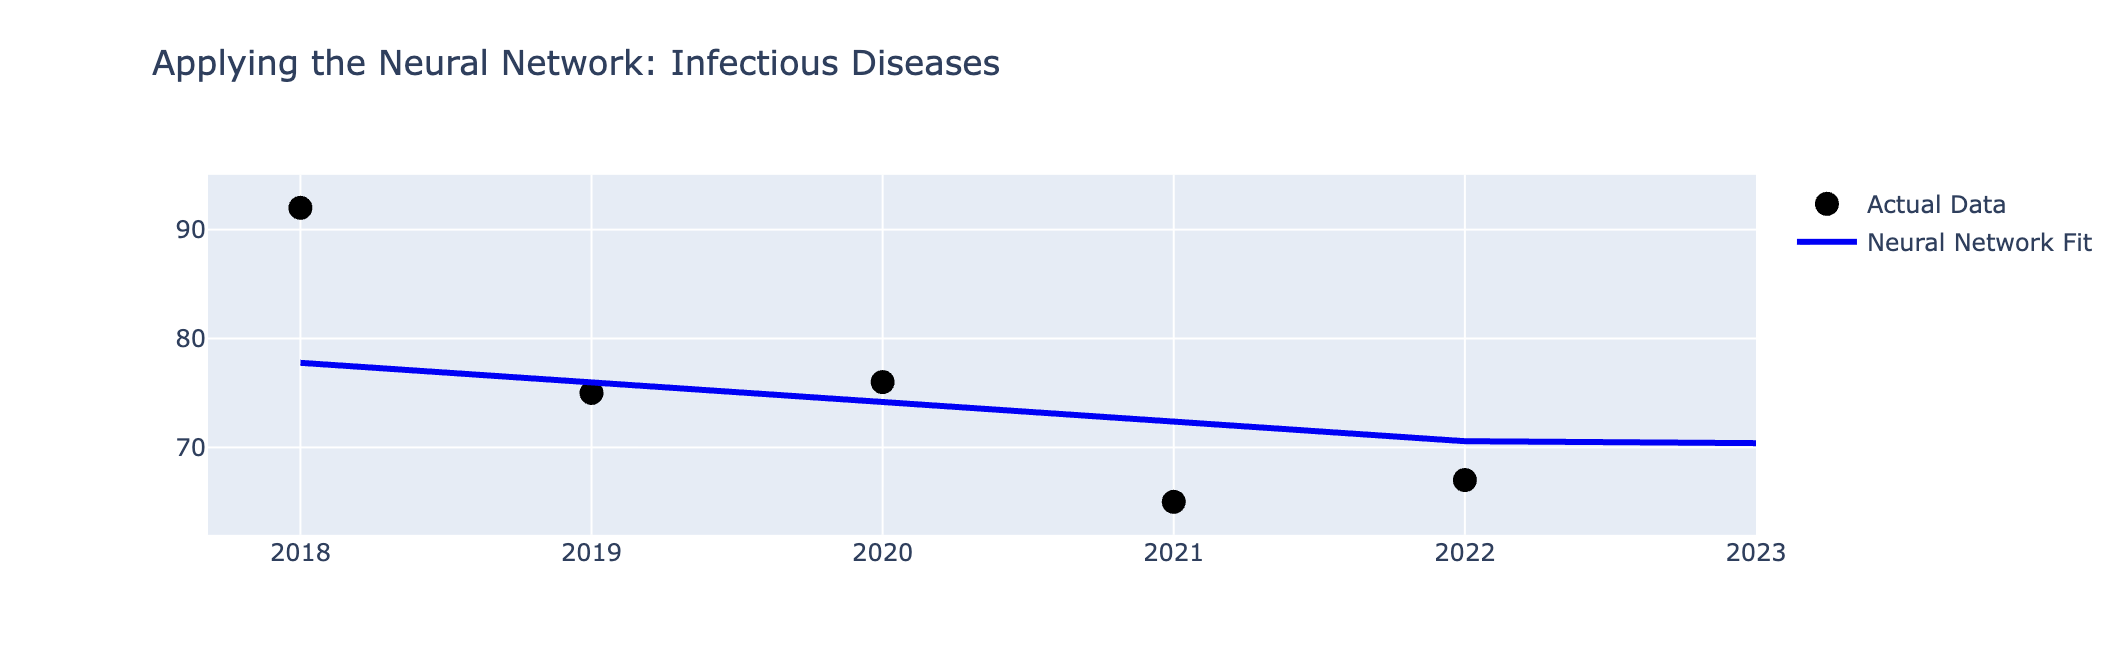
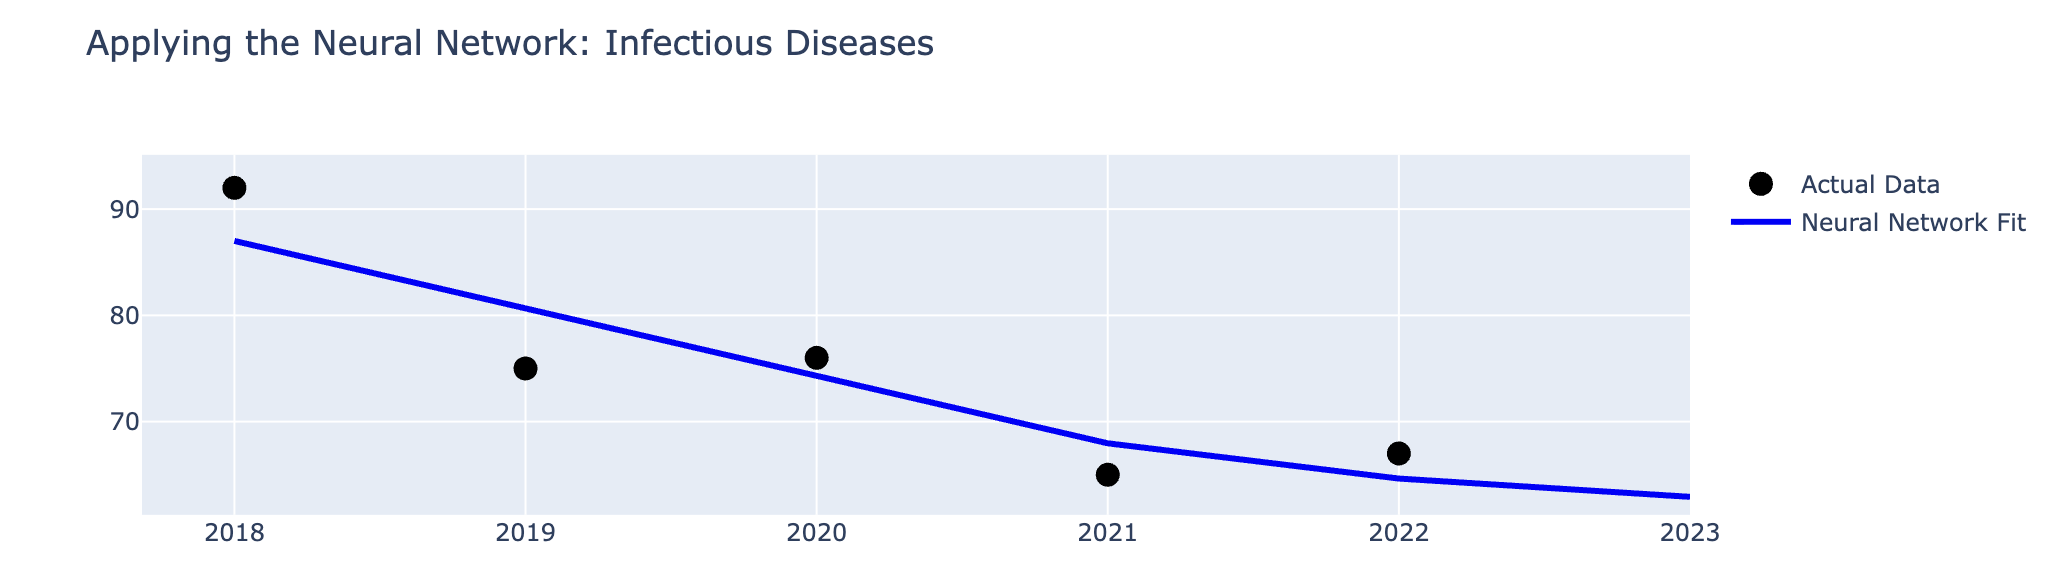
Interestingly, there is a clear difference between 2000 and 3000 iterations, and then the shape of the Neural Network Fit changed incrementally until 10000 iterations -- it was only after 10000 iterations that the warning no longer showed.
2000 iterations:
3000 iterations:
I asked Gemini to explain the logic behind the warning disappearing only at 10,000 iterations, and got this response (summarised).
You might wonder: "Why does a supercomputer need 10,000 tries to learn 5 numbers?"
It is because your Neural Network is too smart for the problem.
You gave it a brain with 100 neurons (parameters).
You gave it only 5 data points (2018-2022).
This is like asking a room full of 100 professors to agree on a pizza topping. They will debate for hours (10,000 iterations) trying to find a complex solution to a simple problem. If you used a simpler model (like Linear Regression), it would have converged in 1 step!
for typeofdisease in df_grouped.index:
    analyse_neural_network(typeofdisease)


/opt/conda/lib/python3.13/site-packages/sklearn/neural_network/_multilayer_perceptron.py:781: ConvergenceWarning:

Stochastic Optimizer: Maximum iterations (10000) reached and the optimization hasn't converged yet.


/opt/conda/lib/python3.13/site-packages/sklearn/neural_network/_multilayer_perceptron.py:781: ConvergenceWarning:

Stochastic Optimizer: Maximum iterations (10000) reached and the optimization hasn't converged yet.

/opt/conda/lib/python3.13/site-packages/sklearn/neural_network/_multilayer_perceptron.py:781: ConvergenceWarning:

Stochastic Optimizer: Maximum iterations (10000) reached and the optimization hasn't converged yet.


/opt/conda/lib/python3.13/site-packages/sklearn/neural_network/_multilayer_perceptron.py:781: ConvergenceWarning:

Stochastic Optimizer: Maximum iterations (10000) reached and the optimization hasn't converged yet.


/opt/conda/lib/python3.13/site-packages/sklearn/neural_network/_multilayer_perceptron.py:781: ConvergenceWarning:

Stochastic Optimizer: Maximum iterations (10000) reached and the optimization hasn't converged yet.


Interestingly, the same Convergence Warning is showing for a few of the categories of diseases... I'm still not sure why!
Next steps?
The application of a machine learning model to my data to make predictions doesn't quite make sense, given the limited timeframe I have (I couldn't find any more reliable data from the Ministry of Health).
A question I have, then, is if it makes sense at all for me to redo everything I've done here, except my "training data" would be for 2018-2021, then have it make a prediction for 2022, and finally compare the prediction to the actual mortality numbers... discrepancies could then highlight changes in the health/healthcare ecosystem of Bhutan?