Session 6: Density Estimation
Assignment
Fit a probability distribution to your data.
In [2]:
import pandas as pd
# Load the data
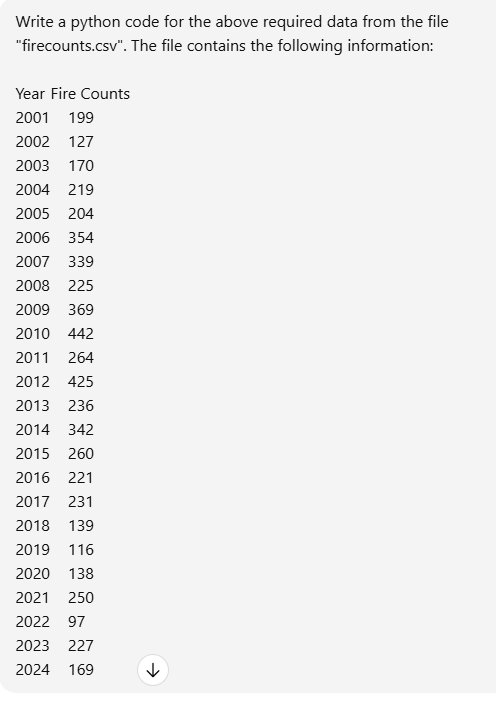
df = pd.read_csv("datasets/firecounts.csv")
# Display the data
print(df)
# Optional: access the columns
years = df["Year"].values
fire_counts = df["Fire Counts"].values
print("Years:", years)
print("Fire Counts:", fire_counts)
    Year  Fire Counts
0   2001          199
1   2002          127
2   2003          170
3   2004          219
4   2005          204
5   2006          354
6   2007          339
7   2008          225
8   2009          369
9   2010          442
10  2011          264
11  2012          425
12  2013          236
13  2014          342
14  2015          260
15  2016          221
16  2017          231
17  2018          139
18  2019          116
19  2020          138
20  2021          250
21  2022           97
22  2023          227
23  2024          169
Years: [2001 2002 2003 2004 2005 2006 2007 2008 2009 2010 2011 2012 2013 2014
 2015 2016 2017 2018 2019 2020 2021 2022 2023 2024]
Fire Counts: [199 127 170 219 204 354 339 225 369 442 264 425 236 342 260 221 231 139
 116 138 250  97 227 169]
For me, understanding the concept of K-means clustering and plotting clusters and their Voronoi-like partition is a weird lesson, without having the basics of coding. However, I am grateful to know how to use AI prompts for self learning. I have used Chatgpt for my lessons with the following prompts.
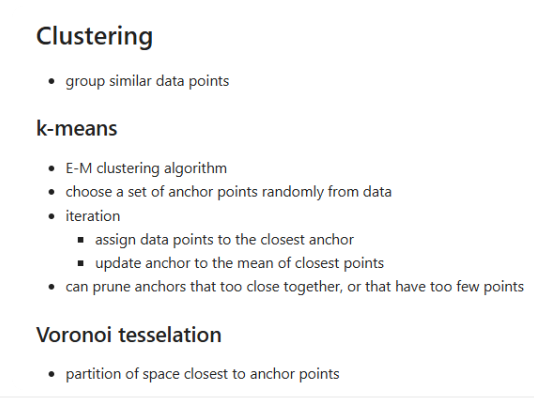
K-means Clustering-Density Estimation
In [1]:
import matplotlib.pyplot as plt
from scipy.spatial import Voronoi, voronoi_plot_2d
import numpy as np
import pandas as pd

#
# k-means parameters
#
nclusters = 3      # choose the number of clusters
nsteps = 10
np.random.seed(0)

#
# load data
#
df = pd.read_csv("datasets/firecounts.csv")

# extract Year and Fire Counts as coordinates
x = df["Year"].values.astype(float)
y = df["Fire Counts"].values.astype(float)

#
# choose starting cluster centers randomly from data
#
indices = np.random.choice(len(x), nclusters, replace=False)
mux = x[indices].astype(float)
muy = y[indices].astype(float)

#
# plot before iteration
#
fig, ax = plt.subplots()
plt.scatter(x, y)
vor = Voronoi(np.stack((mux, muy), axis=1))
voronoi_plot_2d(vor, ax=ax, show_points=True, show_vertices=False, point_size=20)
plt.title("Before k-means iterations")
plt.xlabel("Year")
plt.ylabel("Fire Counts")
plt.show()

#
# k-means iteration
#
for step in range(nsteps):
    # compute distances of every point to every center
    xm = np.outer(x, np.ones(len(mux)))
    ym = np.outer(y, np.ones(len(muy)))
    muxm = np.outer(np.ones(len(x)), mux)
    muym = np.outer(np.ones(len(x)), muy)

    distances = np.sqrt((xm - muxm)**2 + (ym - muym)**2)

    # assign each point to the nearest cluster
    mins = np.argmin(distances, axis=1)

    # update cluster centers
    for k in range(nclusters):
        index = np.where(mins == k)[0]
        if len(index) > 0:
            mux[k] = np.mean(x[index])
            muy[k] = np.mean(y[index])

#
# plot after iteration
#
fig, ax = plt.subplots()
plt.scatter(x, y)

vor = Voronoi(np.stack((mux, muy), axis=1))
voronoi_plot_2d(vor, ax=ax, show_points=True, show_vertices=False, point_size=20)

plt.title("After k-means iterations")
plt.xlabel("Year")
plt.ylabel("Fire Counts")
plt.show()

