Session 7: Transforms
PCA
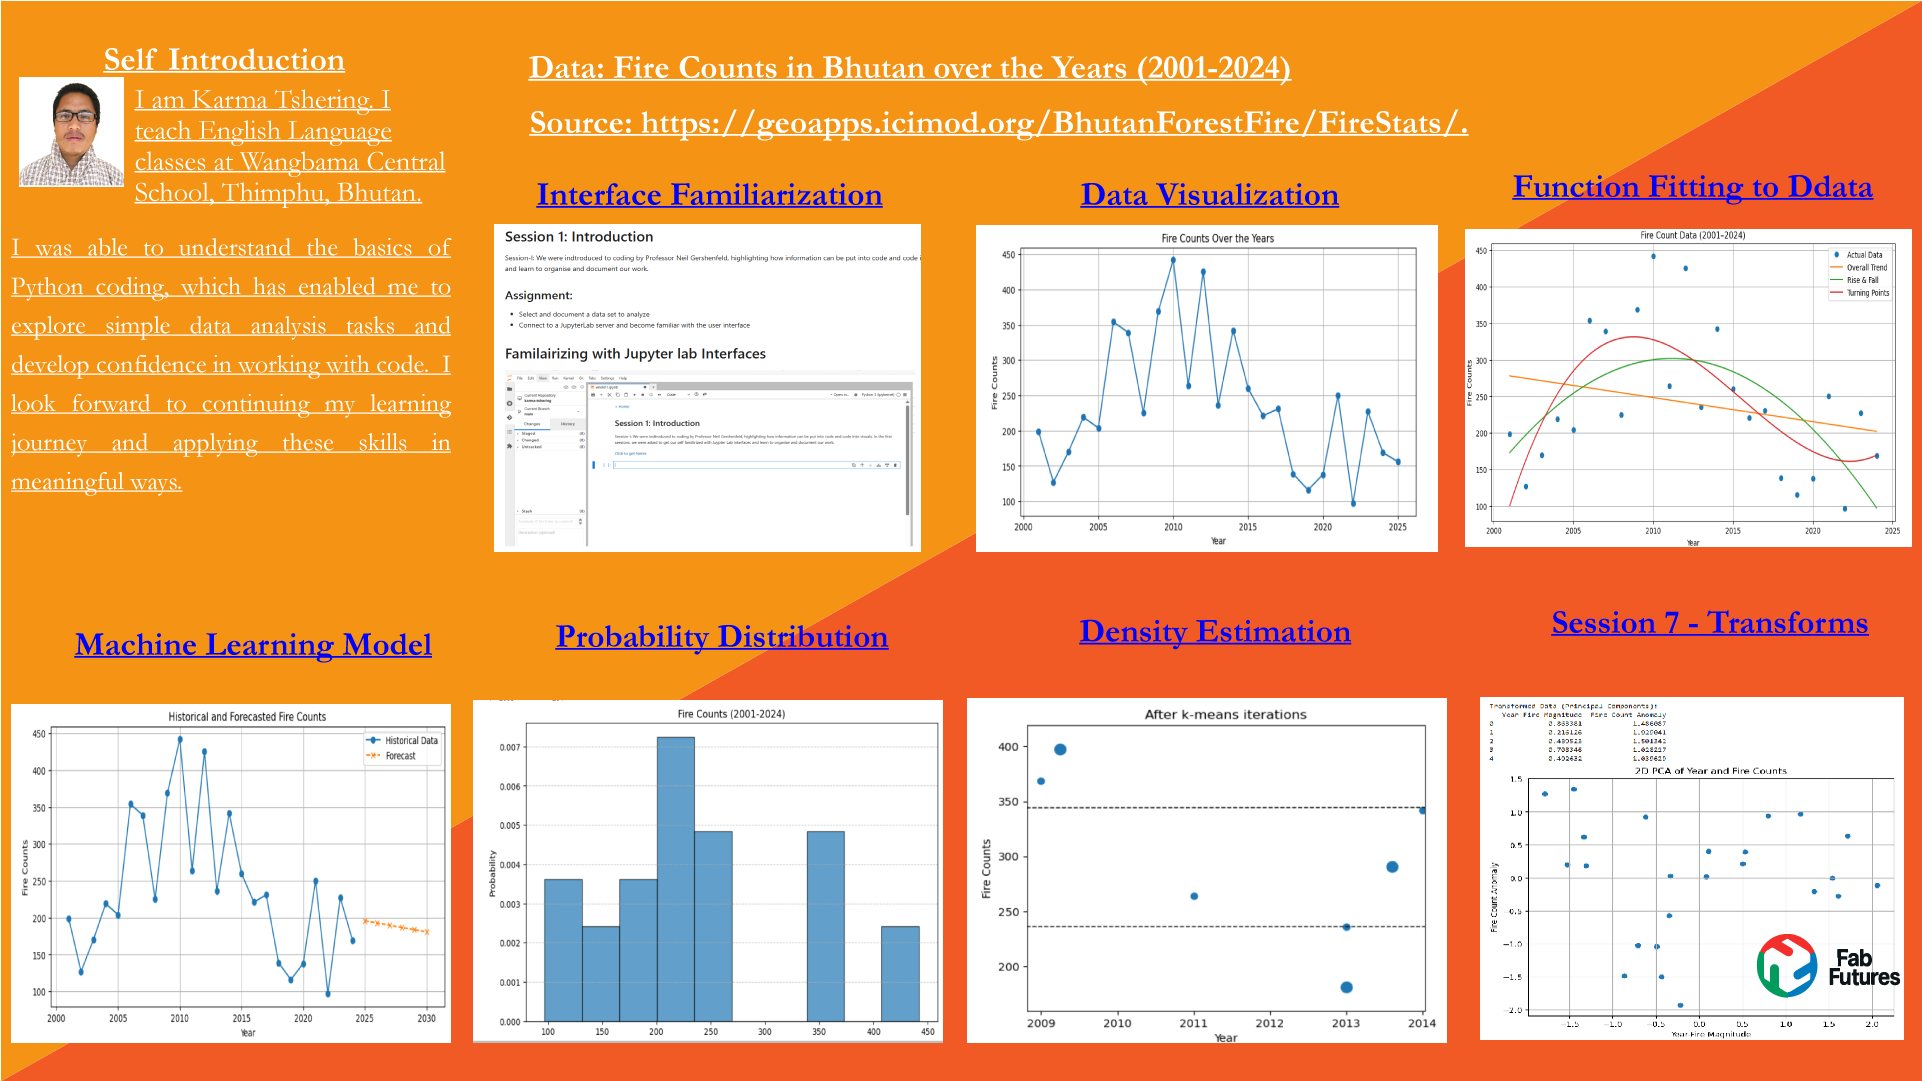
I used the Chatgpt to generate the code for my data set. I made the necessary prompts to represent my data using Chatgpt.
In [7]:
import pandas as pd
from sklearn.preprocessing import StandardScaler
from sklearn.decomposition import PCA
import matplotlib.pyplot as plt

# 1. Define the file path
file_path = "datasets/firecounts.csv"

# 2. Load the data from the specified CSV file
try:
    df_csv = pd.read_csv("datasets/firecounts.csv")
    print(f"✅ Successfully loaded data from: {file_path}")
except FileNotFoundError:
    print(f"❌ Error: File not found at '{file_path}'. Please ensure the file exists and the path is correct.")
    # If the file is not found, we cannot proceed.
    exit()

# Print the first few rows to confirm the load
print("\n## Data Loaded:")
print(df_csv.head())

# 3. Select the features for PCA
# Assuming the CSV columns are named 'Year' and 'Fire Counts'
# (Note: PCA is generally not recommended for 2-variable data where one is time)
X_csv = df_csv[['Year', 'Fire Counts']]

# 4. Standardize the Data (Crucial for PCA)
scaler_csv = StandardScaler()
X_scaled_csv = scaler_csv.fit_transform(X_csv)

# 5. Apply Principal Component Analysis (PCA)
pca_csv = PCA(n_components=2)
principal_components_csv = pca_csv.fit_transform(X_scaled_csv)

# 6. Create a DataFrame for the Principal Components
pca_df_csv = pd.DataFrame(data=principal_components_csv,
                          columns=['Year-Fire Magnitude', 'Fire Count Anomaly'])

print("\n---")
print("## PCA Results:")
print(f"Explained Variance Ratio: {pca_csv.explained_variance_ratio_}")
print("\nTransformed Data (Principal Components):")
print(pca_df_csv.head())

# Optional: Visualize the PCA transformation
plt.figure(figsize=(8, 6))
plt.scatter(pca_df_csv['Year-Fire Magnitude'], pca_df_csv['Fire Count Anomaly'])
plt.title('2D PCA of Year and Fire Counts')
plt.xlabel('Year-Fire Magnitude')
plt.ylabel('Fire Count Anomaly')
plt.grid(True)
plt.show()

print("\n")
✅ Successfully loaded data from: datasets/firecounts.csv

## Data Loaded:
   Year  Fire Counts
0  2001          199
1  2002          127
2  2003          170
3  2004          219
4  2005          204

---
## PCA Results:
Explained Variance Ratio: [0.62214459 0.37785541]

Transformed Data (Principal Components):
   Year-Fire Magnitude  Fire Count Anomaly
0            -0.863381           -1.486087
1            -0.216126           -1.929041
2            -0.439523           -1.501342
3            -0.708346           -1.028217
4            -0.492632           -1.039629

Presentation.png