< Home
Week 1: Introduction
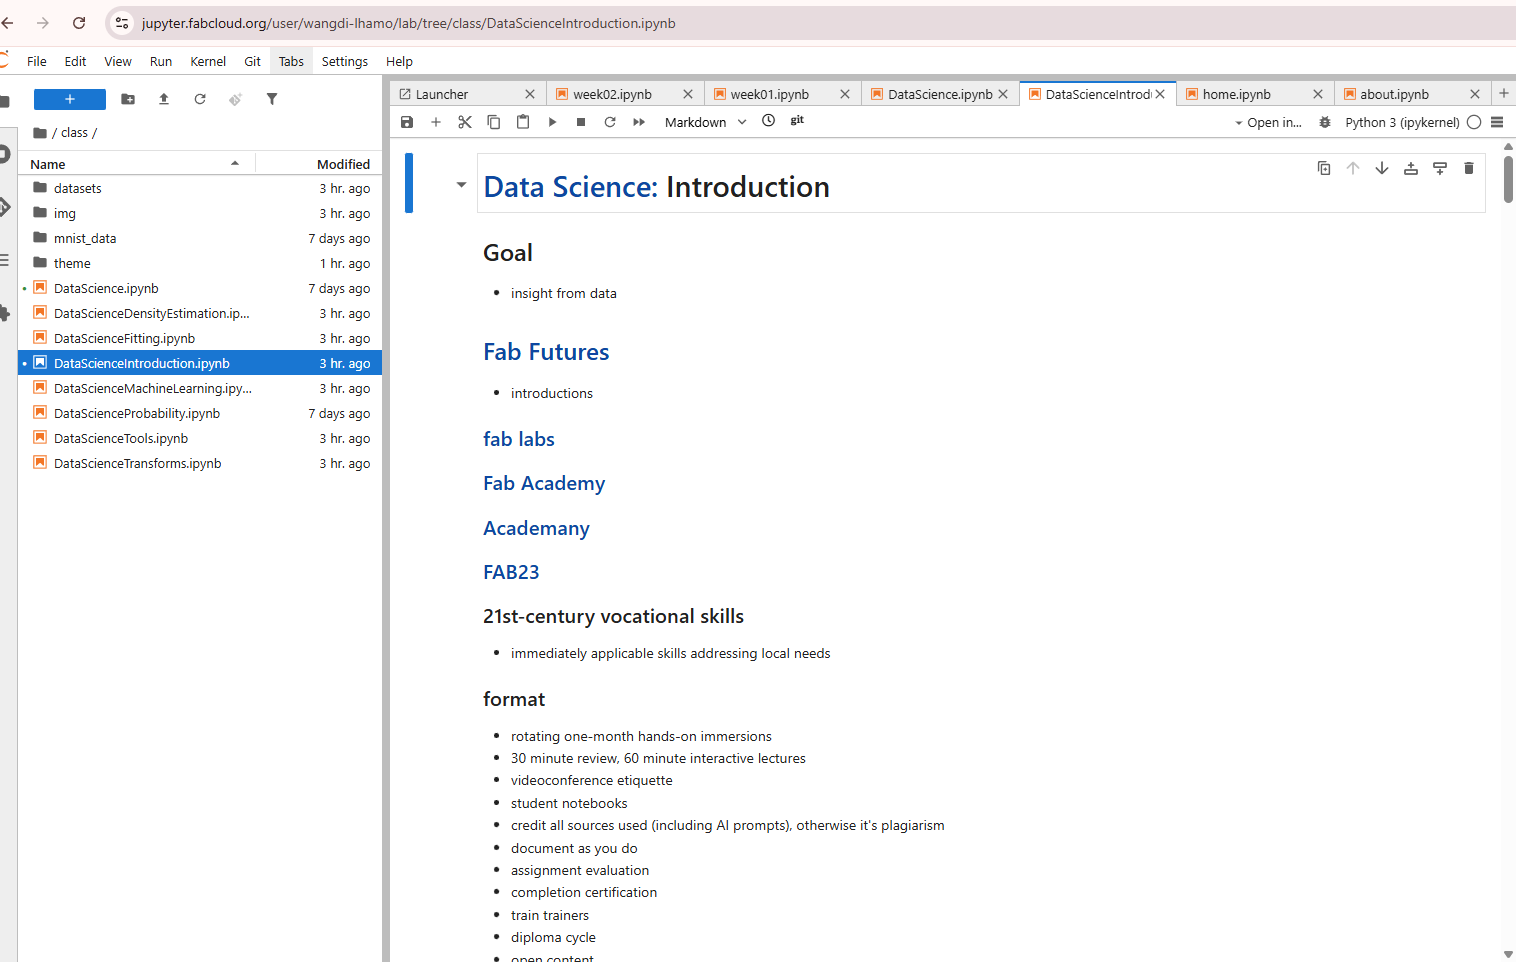
Attended first class on Fab lab(Data science) 18th November 2025. The presenter gave an introduction, and Professor Neil oriented us on the various tools. Professor Neil guided us through the JupyterLab interface in detail, explaining the different tools, panels, and commands available in the environment. He showed us how each feature works, how to navigate the workspace efficiently, and how to use the essential functions needed for running code, managing files, and performing data analysis.
- Goals
- 21st- Century vocational skills
- formats
- schedule for the course and number of examples
What is Fab Lab
Today's session, I explore more on what is acutually a Fab Lab is mean for us. Jupyter usually refers to using Jupyter Notebook as a digital “workspace” for learning, experimenting, and simulating projects related to Fab Labs. In this setup, you can:
Write code to control digital fabrication tools (like 3D printers or CNC machines).
- Simulate designs before physically making them.
- Visualize and analyze data from prototypes or experiments.
- Document the process with code, text, and images in one interactive notebook.
- Essentially, Jupyter acts like a digital Fab Lab, combining coding, experimentation, and documentation in one platform. OpenAI. (2025).
What is a Jupyter Notebook?
Jupyter Notebook is an open-source web tool that allows users to write and run code, visualize data, and create interactive documents combining code, text, and graphics (OpenAI, 2025).
Video import from Youtube
I also tried to explore more on jupyter notebook and learn more on how to run the jupyter notebook.
- importing video from youtube import webbrowser url = "https://www.youtube.com/watch?v=5pf0_bpNbkw&t=932s" webbrowser.open(url)
import webbrowser url = "https://www.youtube.com/watch?v=5pf0_bpNbkw&t=932s" webbrowser.open(url)
Datasets file
Today I learnt what is datasets and types of datasets used in the Jupyter notebook. To my understanding the "Datasets is collection of data you use for analysis, visualization, or machine learning".
| Type | Example | How you load it |
|---|---|---|
| CSV files | student_scores.csv | pd.read_csv("student_scores.csv") |
| Excel files | marks.xlsx | pd.read_excel("marks.xlsx") |
| Images | photos, handwriting images | Using PIL or OpenCV |
| Text files | notes.txt | open("notes.txt") |
| Built-in datasets | iris, titanic | from sklearn import datasets |
| API datasets | weather API, stock prices | Using requests |
(OpenAI, 2025)
Import datasets
import pandas as pd
datasets = pd.read_excel("datasets/student_data_analysis_filled.xlsx")
datasets.head()
| Student ID | Student Name | Class | Assignment 1 | Assignment 2 | Midterm | Final Exam | Total Marks | Percentage | Grade | |
|---|---|---|---|---|---|---|---|---|---|---|
| 0 | S001 | Sonam Wangchuk | VIII | 70 | 65 | 60 | 75 | 270 | 67.5 | C |
| 1 | S002 | Dechen Lhamo | VIII | 71 | 66 | 61 | 76 | 274 | 68.5 | C |
| 2 | S003 | Karma Dorji | VIII | 72 | 67 | 62 | 77 | 278 | 69.5 | C |
| 3 | S004 | Thinley Om | VIII | 73 | 68 | 63 | 78 | 282 | 70.5 | B |
| 4 | S005 | Pema Choden | VIII | 74 | 69 | 64 | 79 | 286 | 71.5 | B |
Displaying all the rows and columns
import pandas as pd
pd.set_option('display.max_rows',None)
pd.set_option('display.max_columns',None)
datasets
| Student ID | Student Name | Class | Assignment 1 | Assignment 2 | Midterm | Final Exam | Total Marks | Percentage | Grade | |
|---|---|---|---|---|---|---|---|---|---|---|
| 0 | S001 | Sonam Wangchuk | VIII | 70 | 65 | 60 | 75 | 270 | 67.50 | C |
| 1 | S002 | Dechen Lhamo | VIII | 71 | 66 | 61 | 76 | 274 | 68.50 | C |
| 2 | S003 | Karma Dorji | VIII | 72 | 67 | 62 | 77 | 278 | 69.50 | C |
| 3 | S004 | Thinley Om | VIII | 73 | 68 | 63 | 78 | 282 | 70.50 | B |
| 4 | S005 | Pema Choden | VIII | 74 | 69 | 64 | 79 | 286 | 71.50 | B |
| 5 | S006 | Jigme Tenzin | VIII | 75 | 70 | 65 | 80 | 290 | 72.50 | B |
| 6 | S007 | Kinley Yangzom | VIII | 76 | 71 | 66 | 81 | 294 | 73.50 | B |
| 7 | S008 | Tshering Dorji | VIII | 77 | 72 | 67 | 75 | 291 | 72.75 | B |
| 8 | S009 | Ugyen Wangmo | VIII | 78 | 65 | 68 | 76 | 287 | 71.75 | B |
| 9 | S010 | Sangay Phuntsho | VIII | 79 | 66 | 69 | 77 | 291 | 72.75 | B |
| 10 | S011 | Kezang Dema | VIII | 70 | 67 | 70 | 78 | 285 | 71.25 | B |
| 11 | S012 | Choki Gyeltshen | VIII | 71 | 68 | 71 | 79 | 289 | 72.25 | B |
| 12 | S013 | Phub Zam | VIII | 72 | 69 | 60 | 80 | 281 | 70.25 | B |
| 13 | S014 | Tandin Wangdi | VIII | 73 | 70 | 61 | 81 | 285 | 71.25 | B |
| 14 | S015 | Passang Lham | VIII | 74 | 71 | 62 | 75 | 282 | 70.50 | B |
| 15 | S016 | Namgay Dorji | VIII | 75 | 72 | 63 | 76 | 286 | 71.50 | B |
| 16 | S017 | Chimi Yangzom | VIII | 76 | 65 | 64 | 77 | 282 | 70.50 | B |
| 17 | S018 | Ngawang Tshering | VIII | 77 | 66 | 65 | 78 | 286 | 71.50 | B |
| 18 | S019 | Dawa Tshering | VIII | 78 | 67 | 66 | 79 | 290 | 72.50 | B |
| 19 | S020 | Pelden Lhamo | VIII | 79 | 68 | 67 | 80 | 294 | 73.50 | B |
(Saral Gyaan, 2023)
Jupyter Nagivation
Browsing Jupyter notebook and importing datasets such as csv, excel and images in the jupyter then link with websites. Create our own biodata and uplaod our own picture, then i tried to link them. however, did so many time but couldn't display on that same day as i am very new to this notebook and didn't know where to upload the documents. So got help our Mr. Anith and finally it works.
Reference
- OpenAI. (2025). Explanation of what Jupyter is [ChatGPT response]. https://chat.openai.com
- Saral Gyaan. (2023, November 12). How to display all the columns/rows of a large Pandas dataframe in Jupyter Notebook? [Video]. YouTube. https://www.youtube.com/watch?v=f1zBr9ZauwM
CODES
Import images
<img alt="" src="images/Code for importing excel files from datasets.png">

Import datasets
import pandas as pd
datasets = pd.read_csv/excel("datesets/Filename.csv")
datasets
(press shift with enter key)