Class 3: Fitting
Neil introduced data fitting in general; why to do it, what you can get out of it and several different methods. The assignment is to fit a function to my data. Instead of using the ocean temperature data, I will try out a spring potentiometer and use it to measure the position of a falling weight.
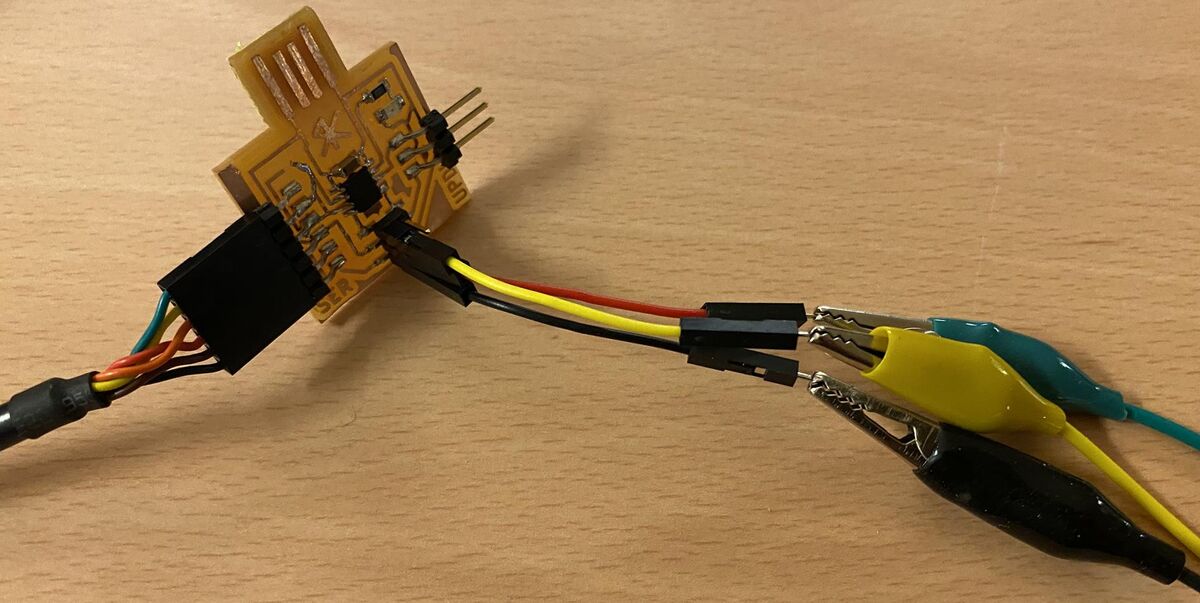
I used an ATtiny412 devboard to make the measurement:
I used the AnalogReadSerial Arduino example, and only changed the pin number from A0 to 2:
/*
  AnalogReadSerial

  Reads an analog input on pin 0, prints the result to the Serial Monitor.
  Graphical representation is available using Serial Plotter (Tools > Serial Plotter menu).
  Attach the center pin of a potentiometer to pin A0, and the outside pins to +5V and ground.

  This example code is in the public domain.

  https://www.arduino.cc/en/Tutorial/BuiltInExamples/AnalogReadSerial
*/

// the setup routine runs once when you press reset:
void setup() {
  // initialize serial communication at 9600 bits per second:
  Serial.begin(9600);
}

// the loop routine runs over and over again forever:
void loop() {
  // read the input on analog pin 0:
  int sensorValue = analogRead(2);
  // print out the value you read:
  Serial.println(sensorValue);
  delay(1);        // delay in between reads for stability
}
Then I used CoolTerm to save the data from the serial connection as per this example. You can get CoolTerm here. One nice thing is that the readme shows how to get permission to access the serial connection on a Linux machine.
import pandas as pd
import matplotlib.pyplot as plt
import numpy as np

df = pd.read_csv('datasets/sensors/drop02.csv')
height = -df['0'][600:-250]
time = np.linspace(0,len(height)-1,len(height))

plt.plot(time,height)
plt.title('Drop test')
plt.xlabel('Time [s]')
plt.ylabel('Height [raw voltage values]')
plt.show()

Now I need to convert the raw voltage values to meters. Let's measure two known positions with the potentiometer:
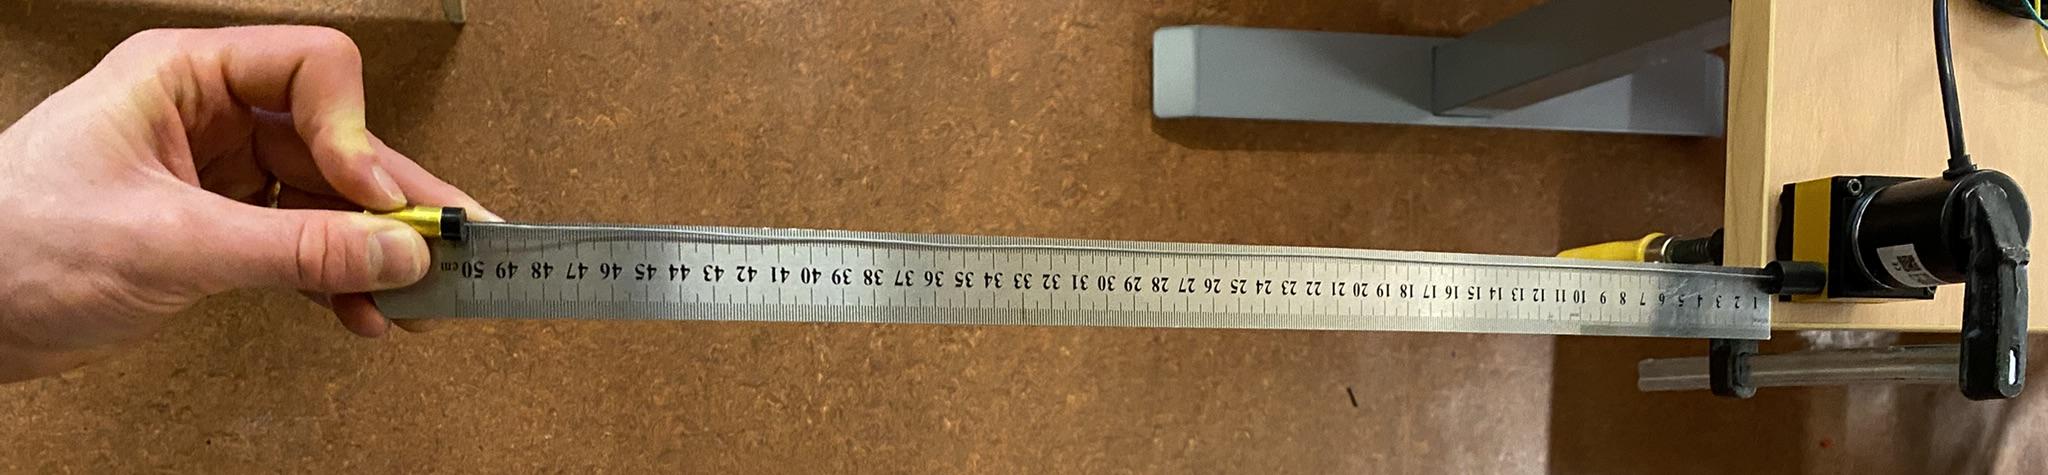
- Analog reading 22 corresponds to position 0
- Analog reading 520 corresponds to position 500 mm
scale_factor = (0.5-0)/(520-22)
print(scale_factor)
0.001004016064257028
height_scaled = scale_factor*height
time_scaled = time/1000
drop02_coeff = np.polyfit(time_scaled,height_scaled,2)
drop02_fit = np.poly1d(drop02_coeff)
plt.plot(time_scaled,height_scaled)
plt.plot(time_scaled,drop02_fit(time_scaled))
plt.title('Drop test')
plt.xlabel('Time [s]')
plt.ylabel('Height [m]')
plt.legend(['Measured data','2nd degree polynomial fit'])
plt.show()

drop02_coeff = np.polyfit(time_scaled[40:-110],height_scaled[40:-110],2)
print(drop02_coeff)
drop02_fit = np.poly1d(drop02_coeff)
plt.plot(time_scaled[40:-110],height_scaled[40:-110])
plt.plot(time_scaled[40:-110],drop02_fit(time_scaled[40:-110]))
plt.title('Drop test')
plt.xlabel('Time [s]')
plt.ylabel('Height [m]')
plt.legend(['Measured data','2nd degree polynomial fit'])
plt.text(0.05,-0.5,'g = ' + str(-2*round(drop02_coeff[0],2)) + ' m/s$^2$', color = 'orange')
plt.show()
[-62.82992697 5.43922707 -0.14169602]

I think I have the height scale factor right, but the gravitational constant that I'm getting is 125m/s2! The time scale factor must be off.