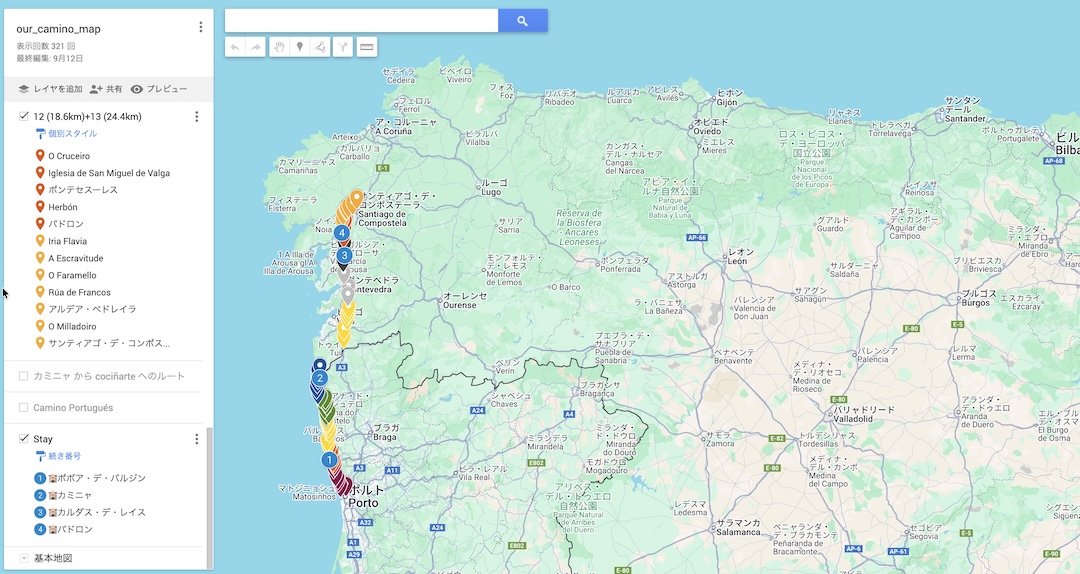
Final 1: My Camino Map
What is it about?
Showing my Camino, from Porto (15 Sep 2025) to Santiago de compostela (19 Sep 2025)
Dataset
A-GeoCat: Saint James' Way to Santiago de Compostela
The Way of St. James or St. James' Way (Caminho de Santiago, Camino de Santiago, Chemin de St-Jacques, Jakobsweg) is the pilgrimage route to the Cathedral of Santiago de Compostela in Galicia in northwestern Spain.
Files
Install GPKG(GeoPackage)
$ pip install geopandas
$ python -c "import geopandas as gpd; print(gpd.__version__)"
1.1.1
# How to verify that it works in JupyterLab

import geopandas as gpd
print("GeoPandas version:", gpd.__version__)
GeoPandas version: 1.1.1
Camino on a map of Spain and Portugal
Prompt(ChatGPT)
Create a sample that loads A-GeoCat’s GPKG in Python and overlays it on a map of Spain.
Answer
!pip install geopandas matplotlibDownload
all 110m cultural themesorne_110m_admin_0_countries.zipfromAdmin 0 – Countriesonhttps://www.naturalearthdata.com/downloads/110m-cultural-vectors/, then copy the .zip to the same dataset folderThe base code is generated
After several times of test, I added some parts in the code :
- Add kmz from Google MyMap
- Add missing segment
- Draw markers and labels
# スペイン+ポルトガルを背景にして、カミーノ全ルートを重ねるコード
# カミーノ全ルート × スペイン+ポルトガル地図を重ねて描画

import geopandas as gpd
import pyogrio
import matplotlib.pyplot as plt

# ======================================
# 1. データのパス
# ======================================
gpkg_path = "datasets/finalproject/caminos_santiago.gpkg"
world_path = "datasets/finalproject/110m_cultural.zip"  # Natural Earth (countries)

# ======================================
# 2. スペイン+ポルトガルの境界線を読み込む
# ======================================
world = gpd.read_file(world_path, layer="ne_110m_admin_0_countries")

# Spain と Portugal のみ抽出
iberia = world[world["ADMIN"].isin(["Spain", "Portugal"])]

# 背景(スペイン+ポルトガル)
fig, ax = plt.subplots(figsize=(10, 10))
iberia.plot(ax=ax, color="lightgray", edgecolor="black", linewidth=0.5)

# ======================================
# 3. Camino GPKG のレイヤー一覧取得
# ======================================
layers = pyogrio.list_layers(gpkg_path)

# LineString のレイヤーだけ抽出
line_layers = [name for name, geom in layers if geom and "LINESTRING" in geom.upper()]

# print("📌 Camino line layers:", line_layers)

# ======================================
# 4. 各ルートをスペイン・ポルトガル地図の上に重ねて描画
# ======================================
for layer in line_layers:
    gdf = gpd.read_file(gpkg_path, layer=layer)
    gdf = gdf.to_crs(iberia.crs)   # 座標系を Iberia(スペイン&ポルトガル)に合わせる
    gdf.plot(ax=ax, linewidth=1)

plt.title("Camino de Santiago — All Routes on Spain & Portugal Map")
plt.xlabel("Longitude")
plt.ylabel("Latitude")
plt.show()

Export layers as kmz file and showing layers name
# Layer name

import pyogrio

kmz_path = "datasets/finalproject/our_camino_map.kmz"

layers = pyogrio.list_layers(kmz_path)

# [('layer name', 'geometry type'])
for layer in layers:
    print(layer)
['1 (24.5km)+2 (14.0km)' 'Unknown']
['3 (24.5km)+4 (20.8km)+5 (26.8km)' 'Unknown']
['Tui - Redondela' 'Unknown']
['6 (23.5km)+7 (16.0km)+8A (22.6km) (Por Oficial)' 'Unknown']
['8B (20.8km) (Por Litoral)+9 (16.0km)' 'Unknown']
['10 (19.6km)+11(21.1km)' 'Unknown']
['12 (18.6km)+13 (24.4km)' 'Unknown']
['カミニャ から cociñarte へのルート' 'Unknown']
['Camino Portugués' 'Unknown']
['Stay' 'Unknown']
Ploting my camino on a map from Natural Earth
import geopandas as gpd
import pandas as pd
from shapely.ops import unary_union
import matplotlib.pyplot as plt

kmz_path = "datasets/finalproject/our_camino_map.kmz"

# 結合したいレイヤー名
target_layers = [
    "1 (24.5km)+2 (14.0km)",
    "3 (24.5km)+4 (20.8km)+5 (26.8km)",
    "Tui - Redondela",
    "10 (19.6km)+11(21.1km)",
    "12 (18.6km)+13 (24.4km)"
]

# ------------------------------
# ① 必要なレイヤーを読み込み
# ------------------------------
gdfs = []
for layer_name in target_layers:
    gdf = gpd.read_file(kmz_path, layer=layer_name)
    gdfs.append(gdf)

# ------------------------------
# ② 全ての gdf を1つにまとめる
# ------------------------------
merged_gdf = gpd.GeoDataFrame(
    pd.concat(gdfs, ignore_index=True),
    crs=gdfs[0].crs
)

# ------------------------------
# ③ 全ての LineString を 1 本に結合(unary_union)
#    → MultiLineString または LineString
# ------------------------------
merged_line = unary_union(merged_gdf.geometry)

# プロット用 GeoSeries
merged_geo = gpd.GeoSeries([merged_line], crs=merged_gdf.crs)

# ------------------------------
# ④ 背景地図(Spain / Portugal)
# ------------------------------
world = gpd.read_file(
    "datasets/finalproject/110m_cultural.zip",
    layer="ne_110m_admin_0_countries"
)
spain = world[world["ADMIN"].isin(["Spain", "Portugal"])]

# ------------------------------
# ⑤ プロット
# ------------------------------
fig, ax = plt.subplots(figsize=(10, 12))

spain.plot(ax=ax, color="lightgray", edgecolor="black")

# 1本に統合した Camino ルート(赤)
merged_geo.plot(ax=ax, color="red", linewidth=1)

plt.title("Merged Google Maps Camino Route")
plt.xlabel("Longitude")
plt.ylabel("Latitude")
plt.show()

Ploting my camino and A-GeoCat on a map from Natural Earth
import geopandas as gpd
import pyogrio
import pandas as pd
from shapely.ops import unary_union
import matplotlib.pyplot as plt

# ======================================
# 1. data path
# ======================================
gpkg_path = "datasets/finalproject/caminos_santiago.gpkg"
world_path = "datasets/finalproject/110m_cultural.zip"
kmz_path = "datasets/finalproject/our_camino_map.kmz"

# ======================================
# 2. Background map (Spain + Portugal)
# 2. 背景地図(スペイン+ポルトガル)
# ======================================
world = gpd.read_file(world_path, layer="ne_110m_admin_0_countries")
iberia = world[world["ADMIN"].isin(["Spain", "Portugal"])]

fig, ax = plt.subplots(figsize=(12, 12))
iberia.plot(ax=ax, color="lightgray", edgecolor="black", linewidth=0.5)

# ======================================
# 3. Overlay all LineString layers from the Camino GPKG in blue
# 3. Camino(GPKG)すべての LineString を青で重ねる
# ======================================
layers = pyogrio.list_layers(gpkg_path)
line_layers = [name for name, geom in layers if geom and "LINESTRING" in geom.upper()]

for layer in line_layers:
    gdf = gpd.read_file(gpkg_path, layer=layer)
    gdf = gdf.to_crs(iberia.crs)
    gdf.plot(ax=ax, color="blue", linewidth=0.8, alpha=0.6)

# ======================================
# 4. Merge multiple routes from the Google KMZ and draw them in red
# 4. Google KMZ 内の複数ルートを結合して赤で描画
# ======================================
target_layers = [
    "1 (24.5km)+2 (14.0km)",
    "3 (24.5km)+4 (20.8km)+5 (26.8km)",
    "Tui - Redondela",
    "10 (19.6km)+11(21.1km)",
    "12 (18.6km)+13 (24.4km)"
]

gdfs = []
for layer_name in target_layers:
    gdf = gpd.read_file(kmz_path, layer=layer_name)
    gdfs.append(gdf)

# Merge all selected routes into a single line
# 全部を1つの GeoDataFrame に結合
merged_gdf = gpd.GeoDataFrame(
    pd.concat(gdfs, ignore_index=True),
    crs=gdfs[0].crs
)

# Merge all selected routes into a single line
# 結合して1本のラインへ
merged_line = unary_union(merged_gdf.geometry)
merged_geo = gpd.GeoSeries([merged_line], crs=merged_gdf.crs)

# Merge all selected routes into a single line
# 背景地図に合わせて CRS 変換
merged_geo = merged_geo.to_crs(iberia.crs)

# Google route (red)
# Google ルート(赤)
merged_geo.plot(ax=ax, color="red", linewidth=1)

# ======================================
# 5. Display the figure
# 5. 図を表示
# ======================================
plt.title("Camino de Santiago — All Routes + Google MyMaps Route")
plt.xlabel("Longitude")
plt.ylabel("Latitude")
plt.show()

import geopandas as gpd
import pyogrio
import pandas as pd
from shapely.ops import unary_union
import matplotlib.pyplot as plt
from shapely.geometry import LineString

# ======================================
# 1. Data paths / データパス
# ======================================
gpkg_path = "datasets/finalproject/caminos_santiago.gpkg"
world_path = "datasets/finalproject/110m_cultural.zip"
kmz_path = "datasets/finalproject/our_camino_map.kmz"

# ======================================
# 2. Background map (Spain + Portugal) / 背景地図(スペイン+ポルトガル)
# ======================================
world = gpd.read_file(world_path, layer="ne_110m_admin_0_countries")
iberia = world[world["ADMIN"].isin(["Spain", "Portugal"])]

fig, ax = plt.subplots(figsize=(12, 12))
iberia.plot(ax=ax, color="lightgray", edgecolor="black", linewidth=0.5)

# ======================================
# 3. Camino full routes from GPKG → blue / GPKGの全カミーノルート → 青で描画
# ======================================
layers = pyogrio.list_layers(gpkg_path)
line_layers = [name for name, geom in layers if geom and "LINESTRING" in geom.upper()]

for layer in line_layers:
    gdf = gpd.read_file(gpkg_path, layer=layer)
    gdf = gdf.to_crs(iberia.crs)
    gdf.plot(ax=ax, color="blue", linewidth=0.8, alpha=0.6)

# ======================================
# 4. Google KMZ route (merge multiple layers) / Google MyMaps の KMZ ルート(複数レイヤーを結合)
# ======================================
target_layers = [
    "1 (24.5km)+2 (14.0km)",
    "3 (24.5km)+4 (20.8km)+5 (26.8km)",
    "Tui - Redondela",
    "10 (19.6km)+11(21.1km)",
    "12 (18.6km)+13 (24.4km)"
]

gdfs = []
for layer_name in target_layers:
    gdf = gpd.read_file(kmz_path, layer=layer_name)
    gdfs.append(gdf)

# KMZ layers combined / KMZの複数レイヤーを結合
merged_gdf = gpd.GeoDataFrame(
    pd.concat(gdfs, ignore_index=True),
    crs=None   # MyMaps KMZ usually has no CRS / MyMapsのKMZは通常CRSがNoneになる
)

# --- Set CRS explicitly to WGS84 / KMZにCRS (WGS84) を明示的に設定 ---
merged_gdf = merged_gdf.set_crs("EPSG:4326")

# Merge into a single LineString / 一本のラインに統合
merged_line = unary_union(merged_gdf.geometry)

# ======================================
# 4b. Add missing red segment / 赤線の切れていた補完区間を追加
# ======================================
extra_coords = [
    (-8.83784, 41.8732),
    (-8.64664, 42.04916)
]

extra_line = LineString(extra_coords)

# Set CRS for extra line / 補完ラインにもCRSを設定
extra_gdf = gpd.GeoSeries([extra_line], crs="EPSG:4326")

# Merge original red route with extra segment / 元ルートと補完区間を結合
full_red_route = unary_union([merged_line, extra_gdf.iloc[0]])

# Convert to GeoSeries and reproject / GeoSeries化して座標系変換
full_red_geo = gpd.GeoSeries([full_red_route], crs="EPSG:4326")
full_red_geo = full_red_geo.to_crs(iberia.crs)

# Draw red route / 赤ルートを描画
full_red_geo.plot(ax=ax, color="red", linewidth=2)

# ======================================
# 5. Add start (Porte) & goal (Santiago) markers
#    出発点(Porte)と到着点(Santiago)にマーカーを追加
# ======================================
porte_lat = 41.087913089618894
porte_lon = -8.54339873871034

santiago_lat = 42.88206527707834
Santiago_lon = -8.55135182575899

# Draw markers and labels / マーカーとラベルを描く
ax.scatter(porte_lon, porte_lat, color="black", s=60, zorder=5)
ax.text(porte_lon, porte_lat, "Porte", fontsize=12, ha="left", va="bottom")

ax.scatter(Santiago_lon, santiago_lat, color="black", s=60, zorder=5)
ax.text(Santiago_lon, santiago_lat, "Santiago", fontsize=12, ha="left", va="bottom")

# ======================================
# 6. Show figure / 図の描画
# ======================================
plt.title("Camino de Santiago — All Routes + Google MyMaps Route + Start/Goal Points")
plt.xlabel("Longitude")
plt.ylabel("Latitude")
plt.show()

Porte to Santiago
import geopandas as gpd
import pyogrio
import pandas as pd
from shapely.ops import unary_union
from shapely.geometry import LineString, box
import matplotlib.pyplot as plt

# ======================================
# 1. Data paths / データパス
# ======================================
gpkg_path = "datasets/finalproject/caminos_santiago.gpkg"
world_path = "datasets/finalproject/110m_cultural.zip"
kmz_path = "datasets/finalproject/our_camino_map.kmz"

# ======================================
# 2. Background map: Spain + Portugal
# 2. 背景地図(スペイン+ポルトガル)
# ======================================
world = gpd.read_file(world_path, layer="ne_110m_admin_0_countries")
iberia = world[world["ADMIN"].isin(["Spain", "Portugal"])]

# CRS
target_crs = iberia.crs

# ======================================
# 3. Blue route layers (GPKG Camino routes)
# 3. 青ルート:GPKG の Camino 公式ルート
# ======================================
blue_layers = [
    "CPC — e01- A GUARDA - OIA",
    "CPC — e02- OIA- BAIONA",
    "CPC — e03- BAIONA - VIGO",
    "CPC — e04- VIGO - REDONDELA",
    "CPO — e01- TUI - O PORRIÑO",
    "CPO — e02- O PORRIÑO - REDONDELA",
    "CPO — e03- REDONDELA - PONTEVEDRA",
    "CPO — e04- PONTEVEDRA - CALDAS DE REIS",
    "CPO — e05- CALDAS DE REIS - PADRÓN",
    "CPO — e06- PADRÓN - SANTIAGO DE COMPOSTELA"
]

blue_gdfs = []
for layer in blue_layers:
    gdf = gpd.read_file(gpkg_path, layer=layer)
    gdf = gdf.to_crs(target_crs)
    blue_gdfs.append(gdf)

blue_routes = pd.concat(blue_gdfs, ignore_index=True)

# ======================================
# 4. Red route: Google KMZ + interpolation
# 4. 赤ルート:Google KMZ + 補完区間
# ======================================
target_layers = [
    "1 (24.5km)+2 (14.0km)",
    "3 (24.5km)+4 (20.8km)+5 (26.8km)",
    "Tui - Redondela",
    "10 (19.6km)+11(21.1km)",
    "12 (18.6km)+13 (24.4km)"
]

kmz_gdfs = []
for layer_name in target_layers:
    gdf = gpd.read_file(kmz_path, layer=layer_name)
    kmz_gdfs.append(gdf)

merged_gdf = gpd.GeoDataFrame(
    pd.concat(kmz_gdfs, ignore_index=True),
    crs="EPSG:4326"
)

merged_line = unary_union(merged_gdf.geometry)

# ---- interpolation line / 補完線 ----
extra_line = LineString([
    (-8.83784, 41.8732),
    (-8.64664, 42.04916)
])

# unify red route / 赤ルートを結合
full_red_route = unary_union([merged_line, extra_line])

# red → CRS transform / 座標系変換
full_red_geo = gpd.GeoSeries([full_red_route], crs="EPSG:4326")
full_red_geo = full_red_geo.to_crs(target_crs)

# ======================================
# 5. Trim map to area of interest
# 5. 地図を「Porte → Santiago」付近にトリミング
# ======================================
xmin, ymin = -9.5, 40.8
xmax, ymax = -8.3, 43.1
clip_box = box(xmin, ymin, xmax, ymax)

# ======================================
# 6. Plot
# ======================================
fig, ax = plt.subplots(figsize=(12, 12))

# Iberia clipped / イベリア半島のクリップ
iberia_clipped = gpd.clip(iberia, clip_box)
iberia_clipped.plot(ax=ax, color="lightgray", edgecolor="black")

# blue routes / 青ルート
gpd.clip(blue_routes, clip_box).plot(ax=ax, color="blue", linewidth=1, alpha=0.6)

# red route / 赤ルート
gpd.clip(full_red_geo, clip_box).plot(ax=ax, color="red", linewidth=2)

# start / goal
ax.scatter(-8.5433987, 41.087913, color="black", s=60)
ax.text(-8.5433987, 41.087913, "Porte", fontsize=12)

ax.scatter(-8.5513518, 42.882065, color="black", s=60)
ax.text(-8.5513518, 42.882065, "Santiago", fontsize=12)

plt.title("Camino de Santiago — Portuguese Coastal + Central Routes")
plt.xlabel("Longitude")
plt.ylabel("Latitude")
plt.show()
