< Home
Week 1: Introduction
I'm going to tell you about my experience this week, come along.
Preparing the system
November 17, 2025
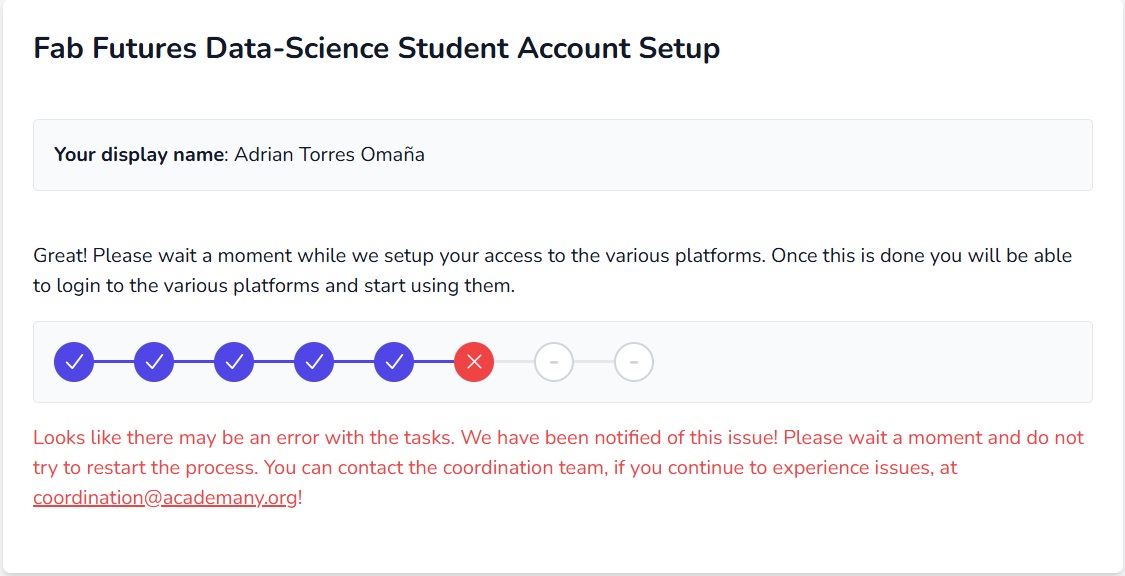
After seeing the email from Coordination, I'm going to deploy Jupyter in my environment. It's something new for me, and I'm both excited and apprehensive.
Well, the first thing that happens to me is a 500 error...
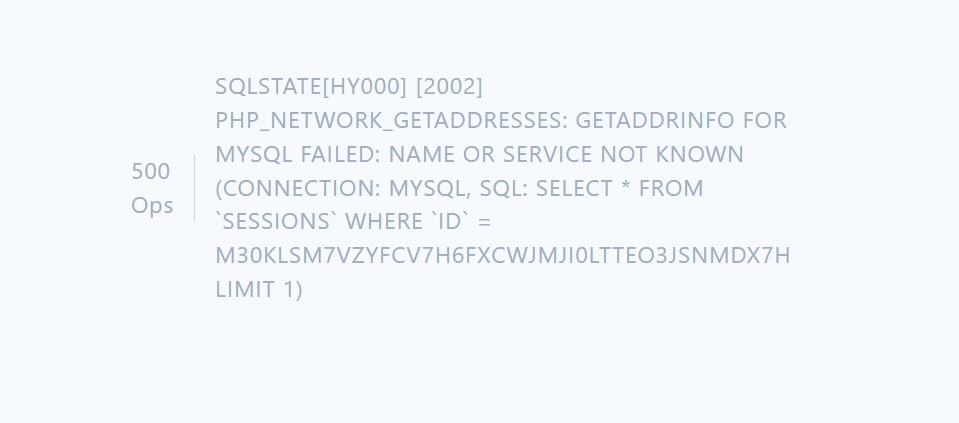
It's strange, I write to Julian and Jean Michel... And then I refresh the browser... it seems to work... but it doesn't, haha.
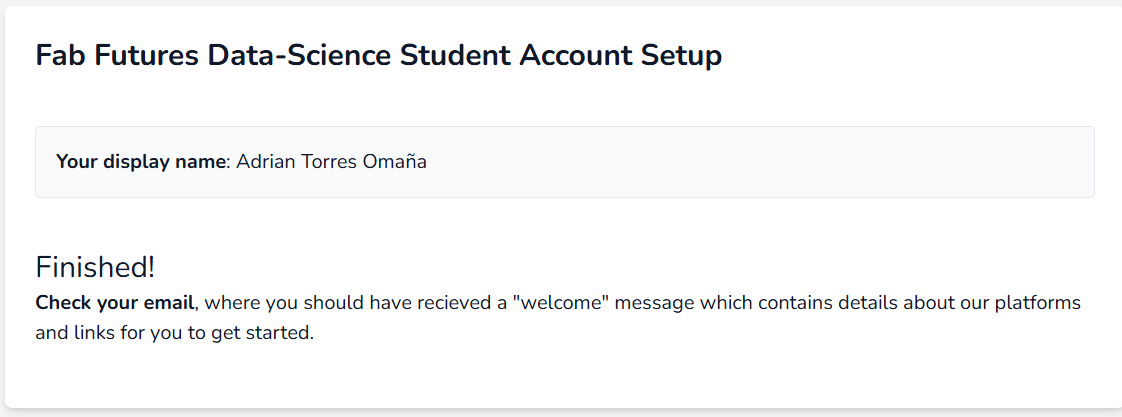
Julian replied a little while later and told me he saw my mistakes and fixed them. Thank you, Julian! :heart:
Once it was up and running, I modified my Bio a bit and had to remember how to use Markdown commands. More to come tomorrow.
Discovering Jupyter
November 18, 2025
After attending the class, I will document how to use Git within Jupyter and how to do the process.
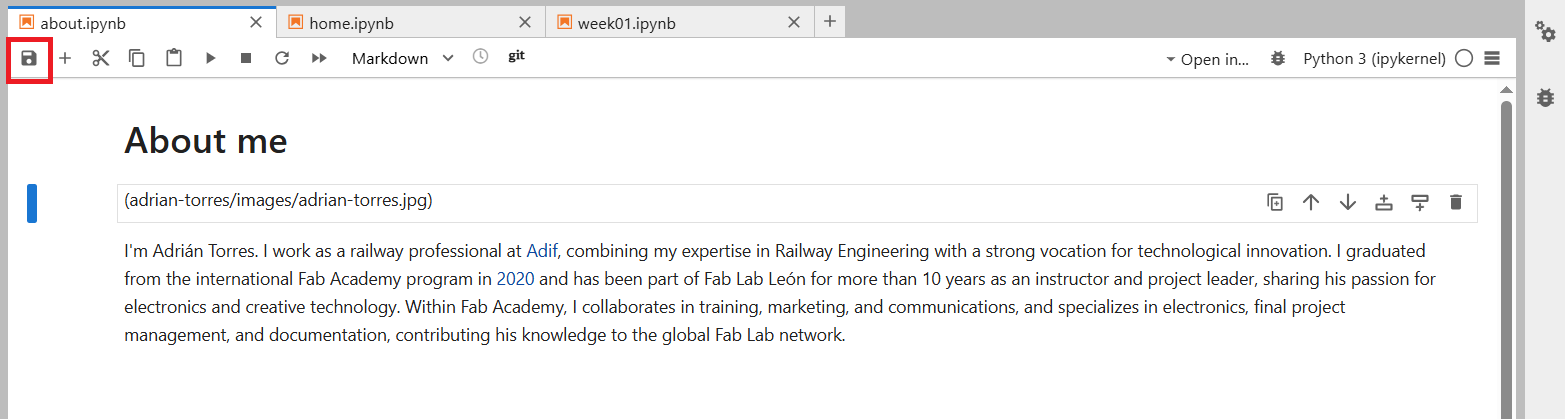
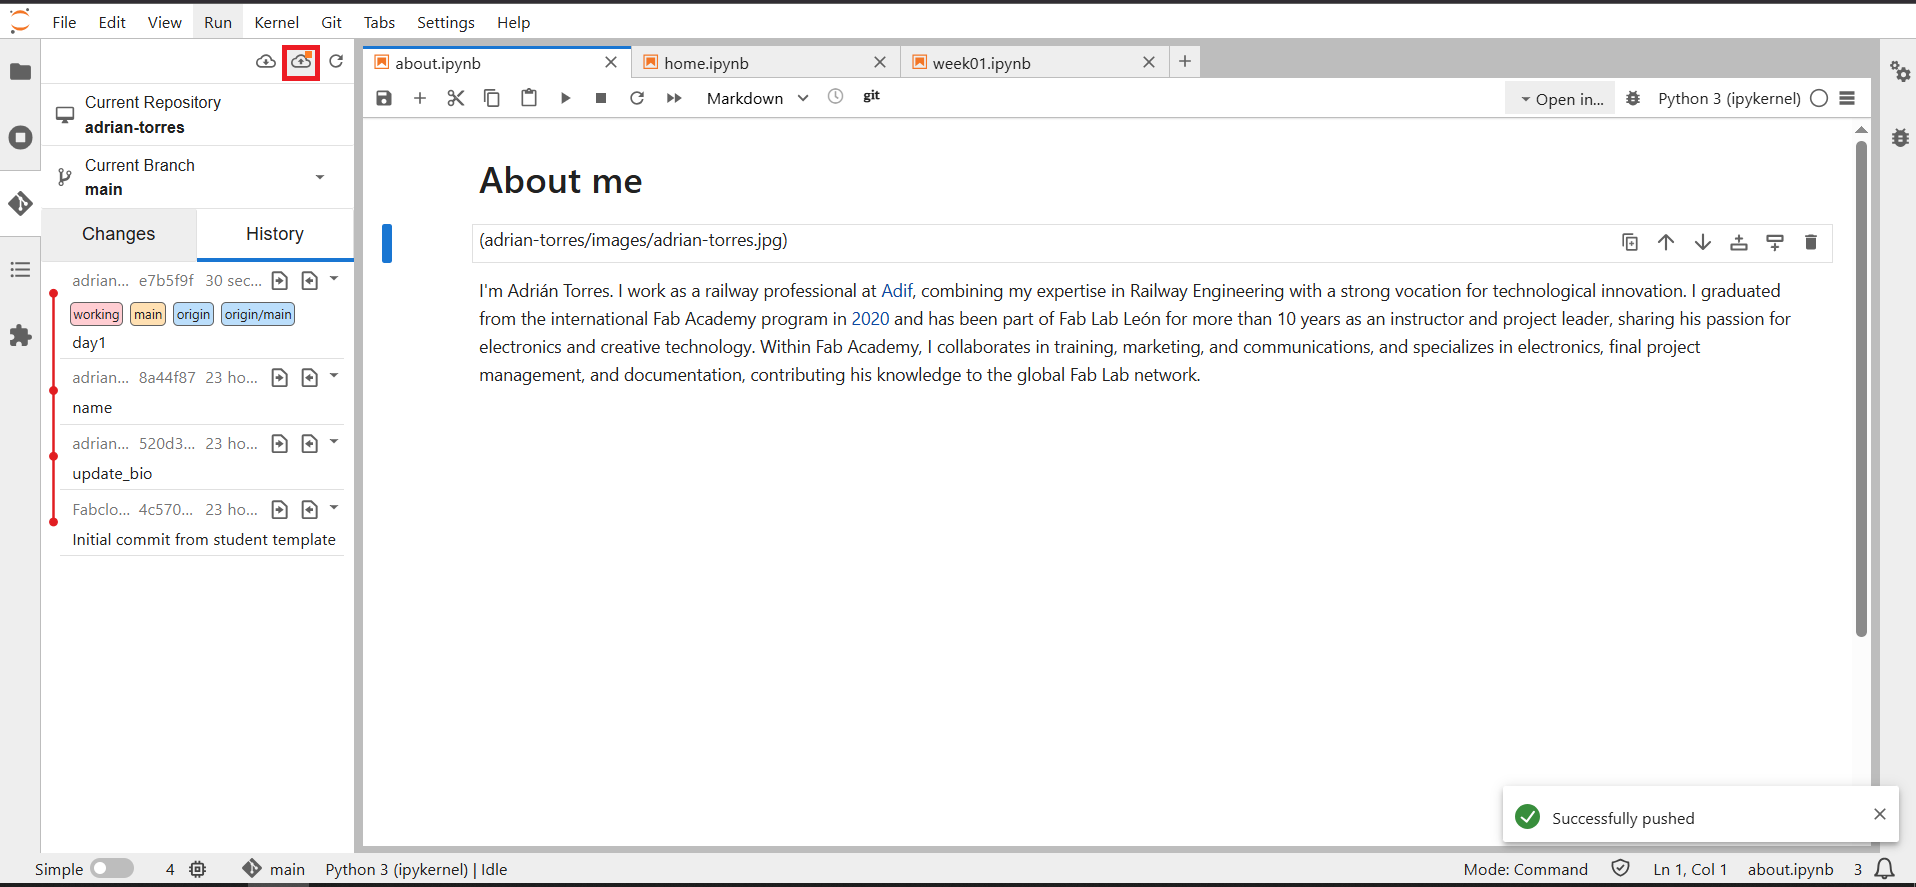
- Once the pages on the website have been modified, it's time to save everything.
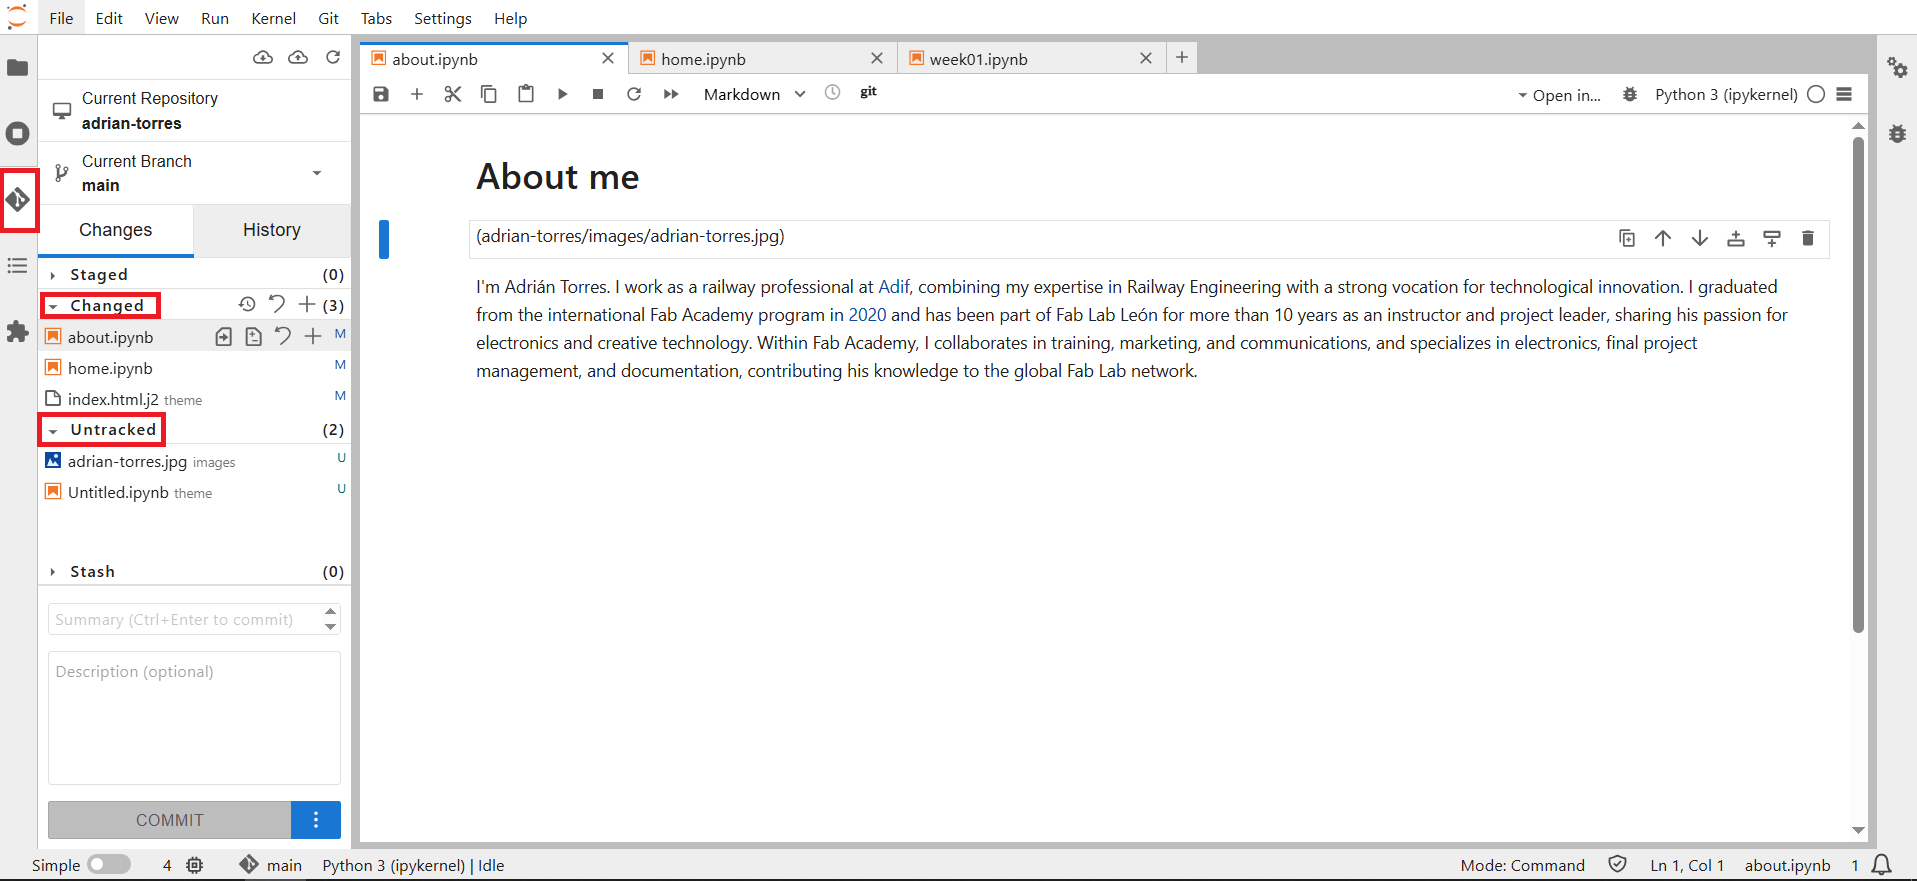
- Now, in the left-hand menu, we find the GIT logo. We click on it, and a drop-down menu appears. We see changes and untracked items such as uploaded images.
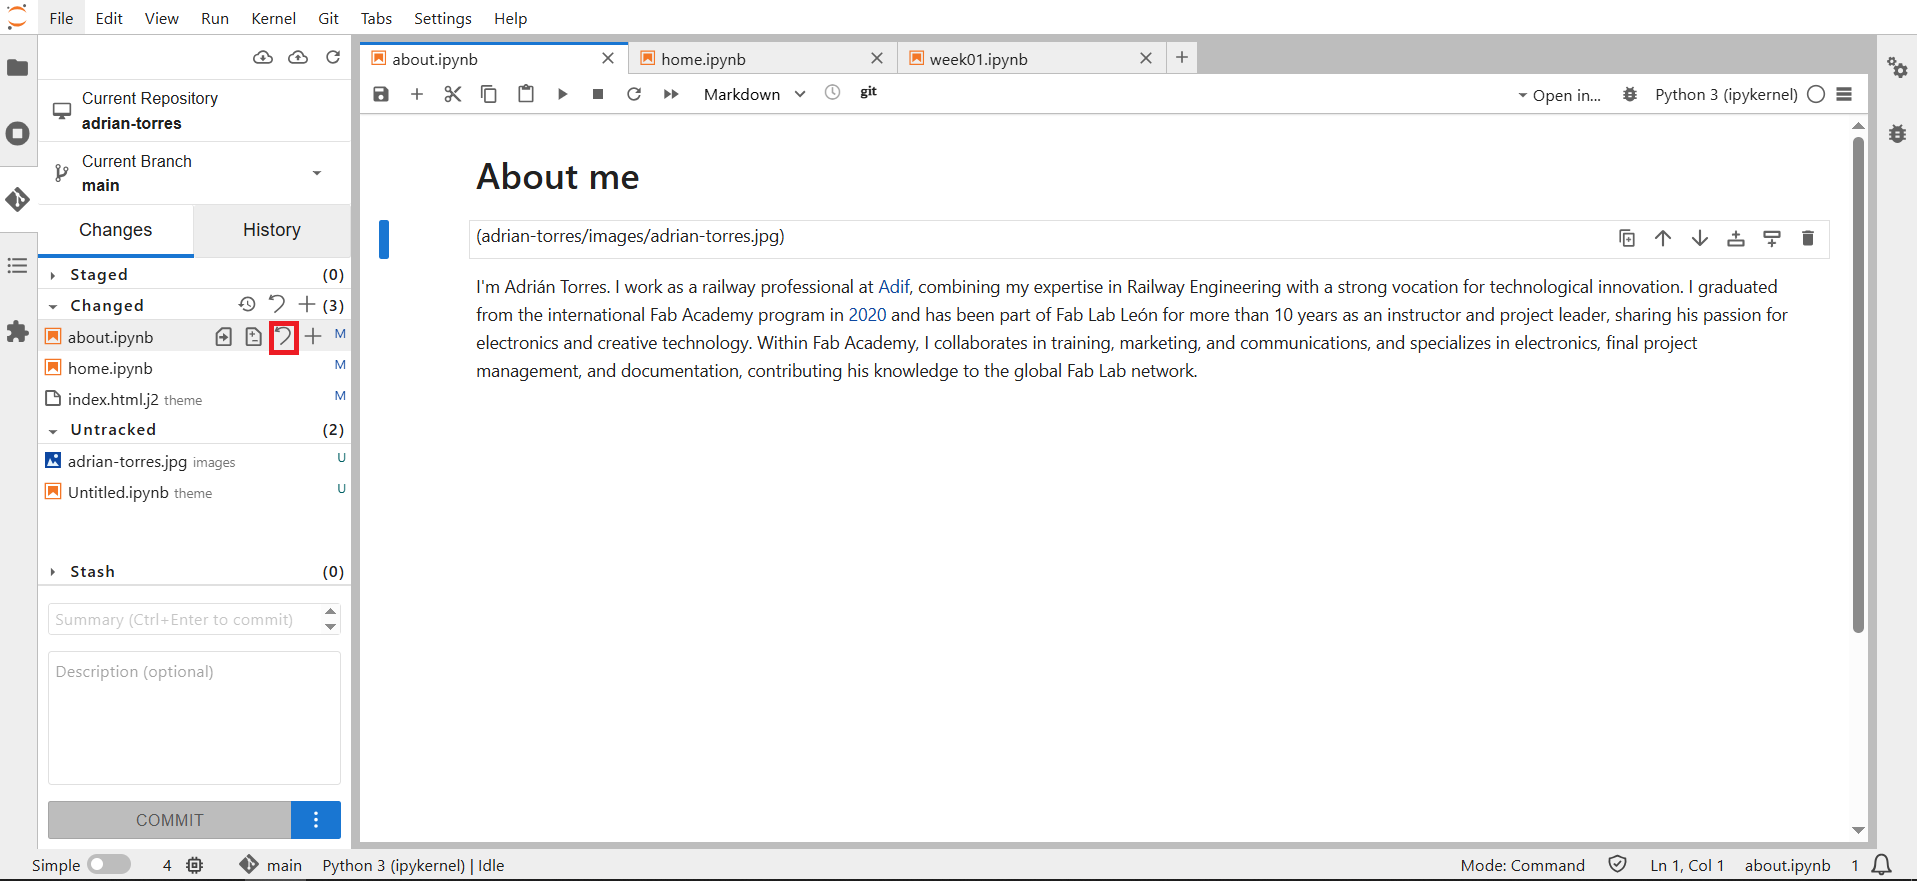
- We press the "stage this change" button
- This automatically moves all files to Staged. Now we need to name the commit and add a comment (optional), then click the Commit button.
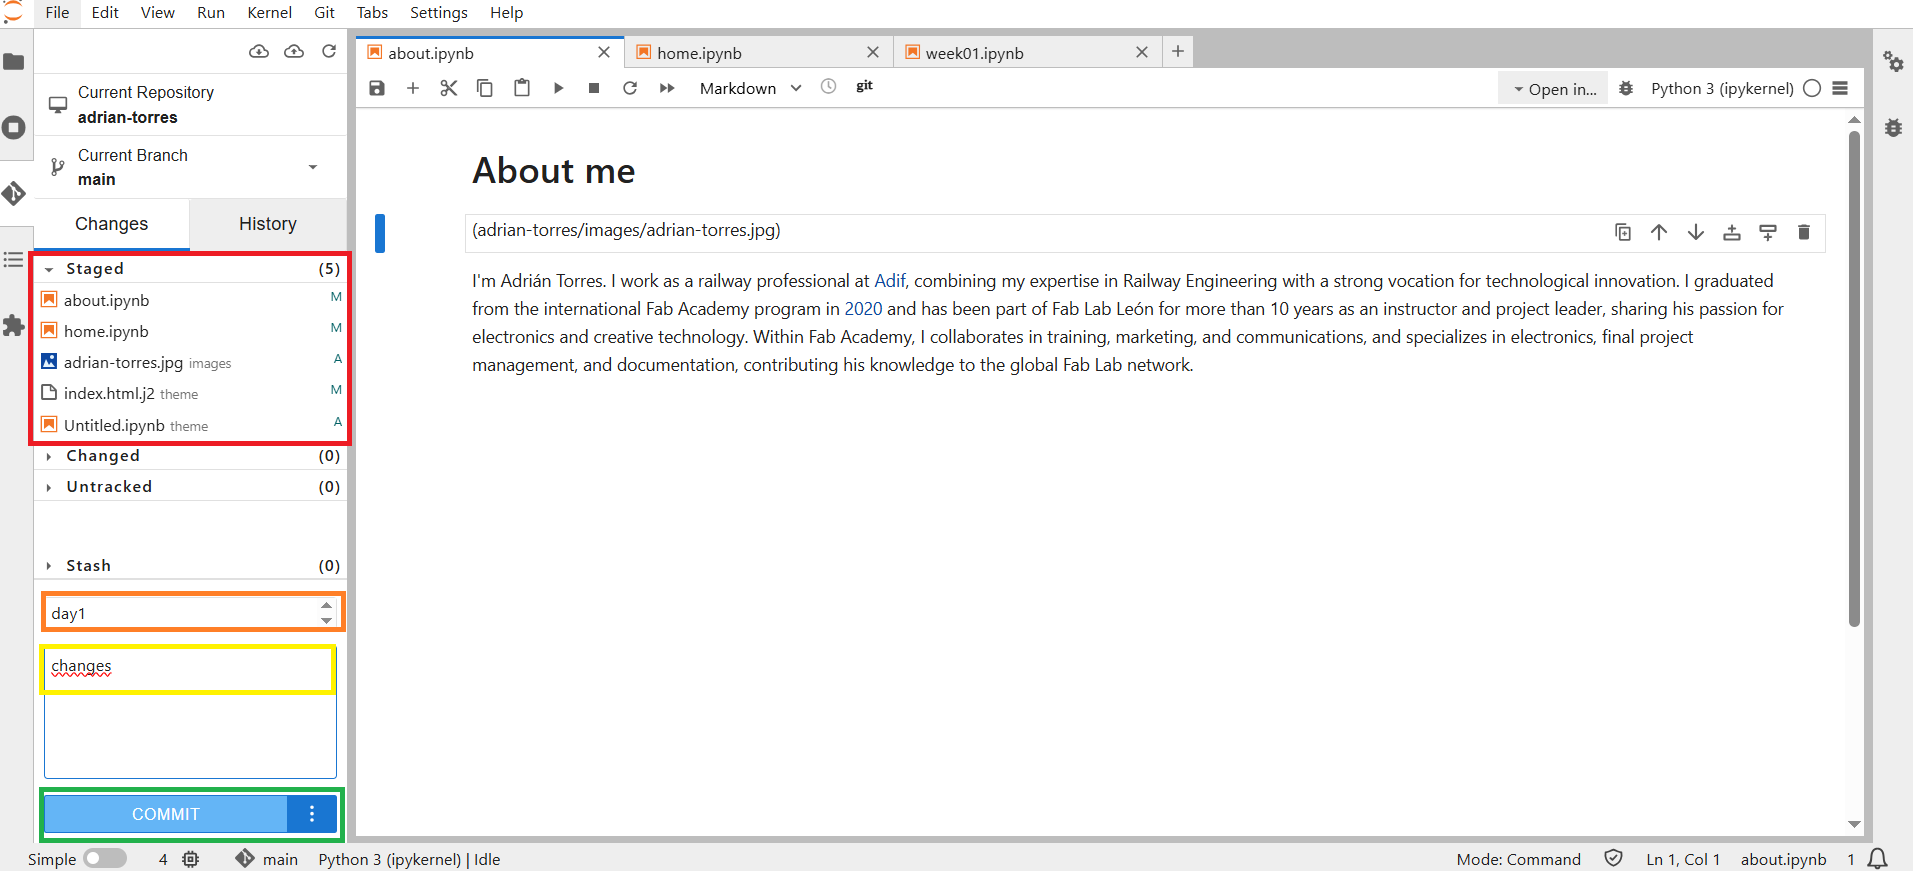
- The last step, if we're sure, is the Push. Next to the cloud, you'll see a small orange dot; tap it to send the Push.
How to add a photo
To add a photo, upload it to the "images" folder in PNG or JPG format. Remember to compress the photos first.
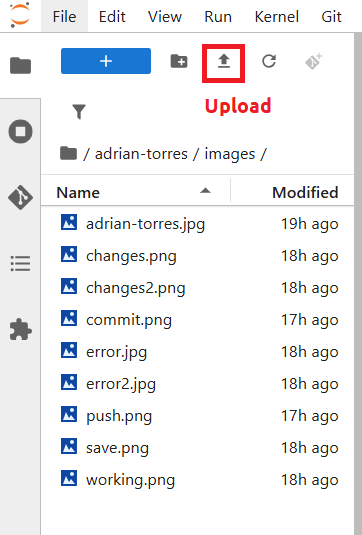
Once the photo is uploaded, we need to use this command to view it. Important: display it as Markdown.
<img alt="" src="images/changes.png"/>
Select and document a data set to analyze
November 19, 2025
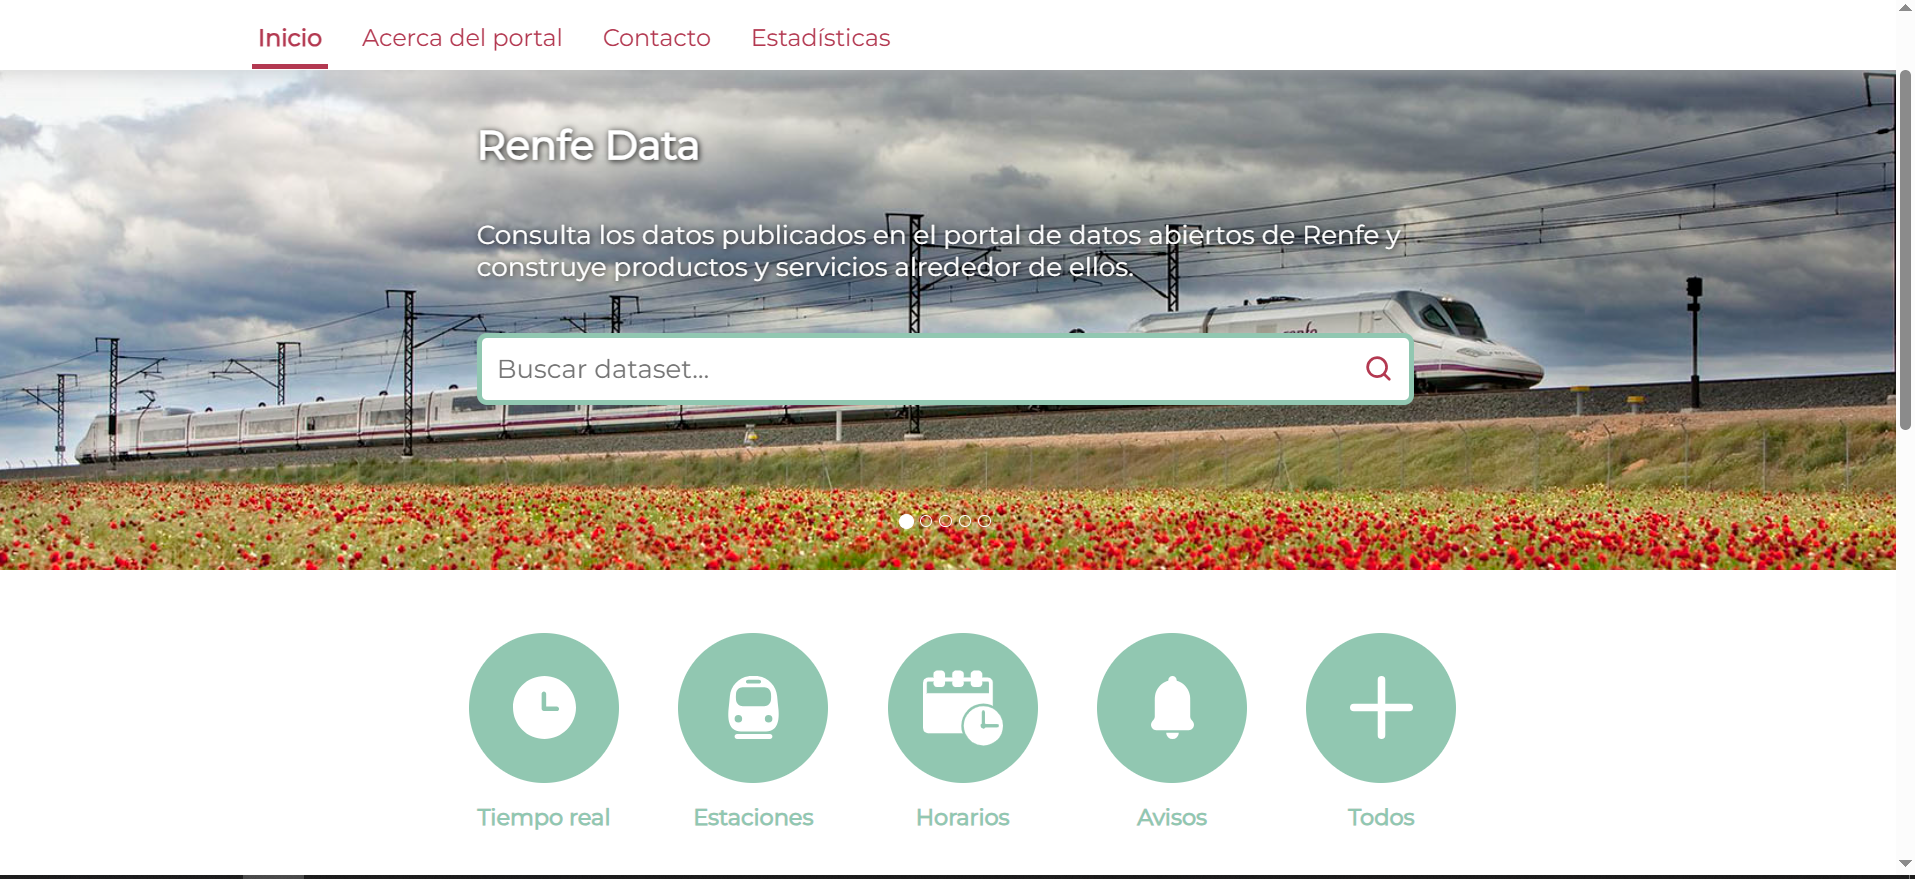
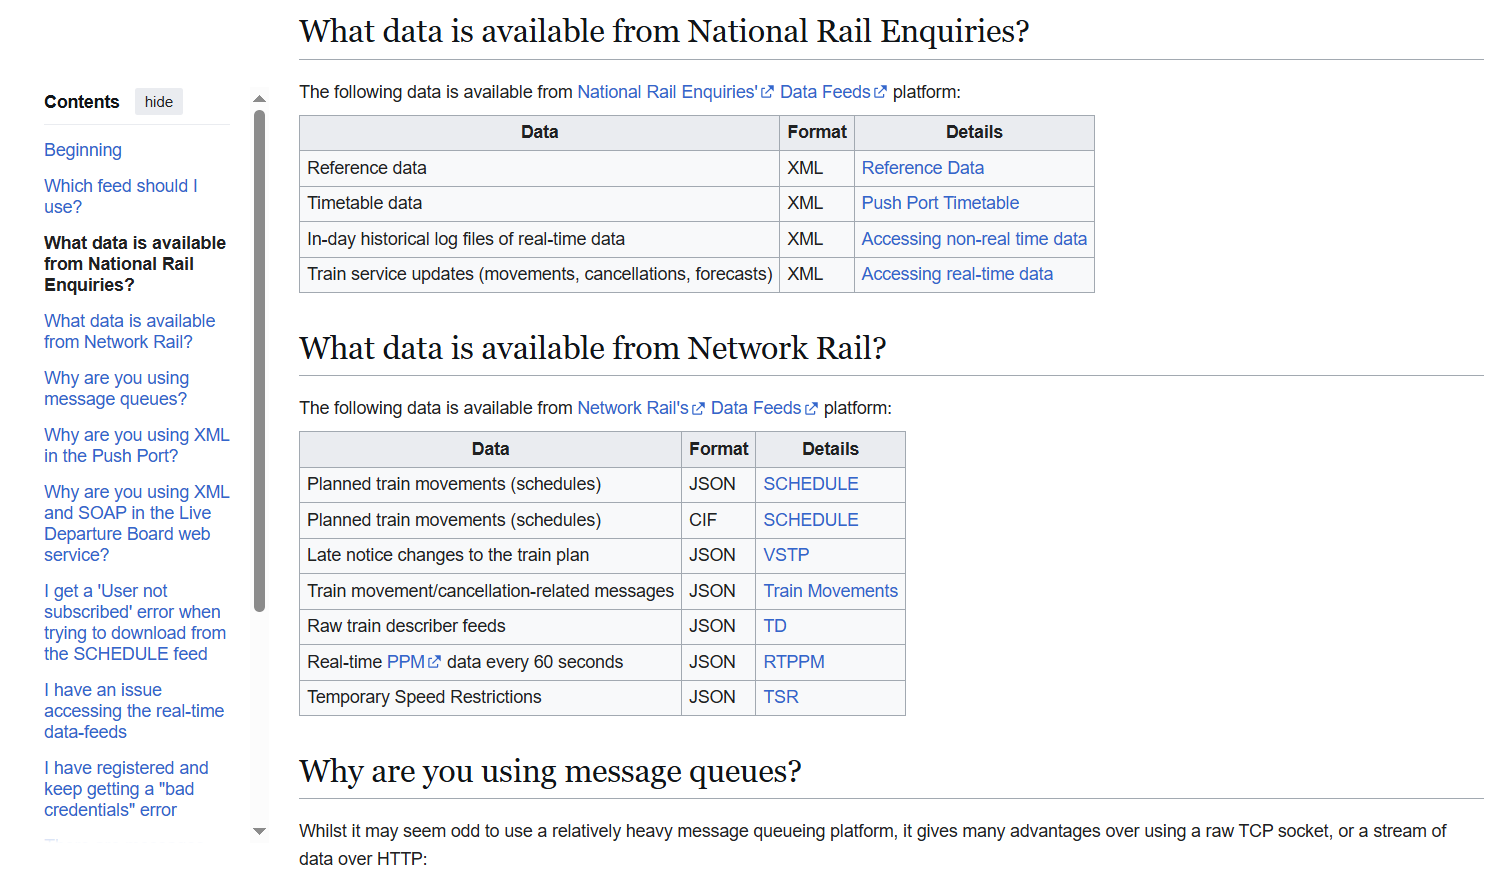
I would like to research and discover information about transportation, in my case rail transportation. To that end, I've seen that with the links Neil posted during class, there are two possible sources of information: Renfe, in my country (interesting that they have their data open) and Network Rail and National Rail (UK).
Renfe Data: offers various datasets, including real-time data, station information, timetables, and announcements. It may be of interest. It is available in JSON, CSV, and XML formats.
Network Rail and National Rail (UK): Uses a Wiki page, where there are also links to JSON, XLS or CSV.
Possible target of Fab Futures
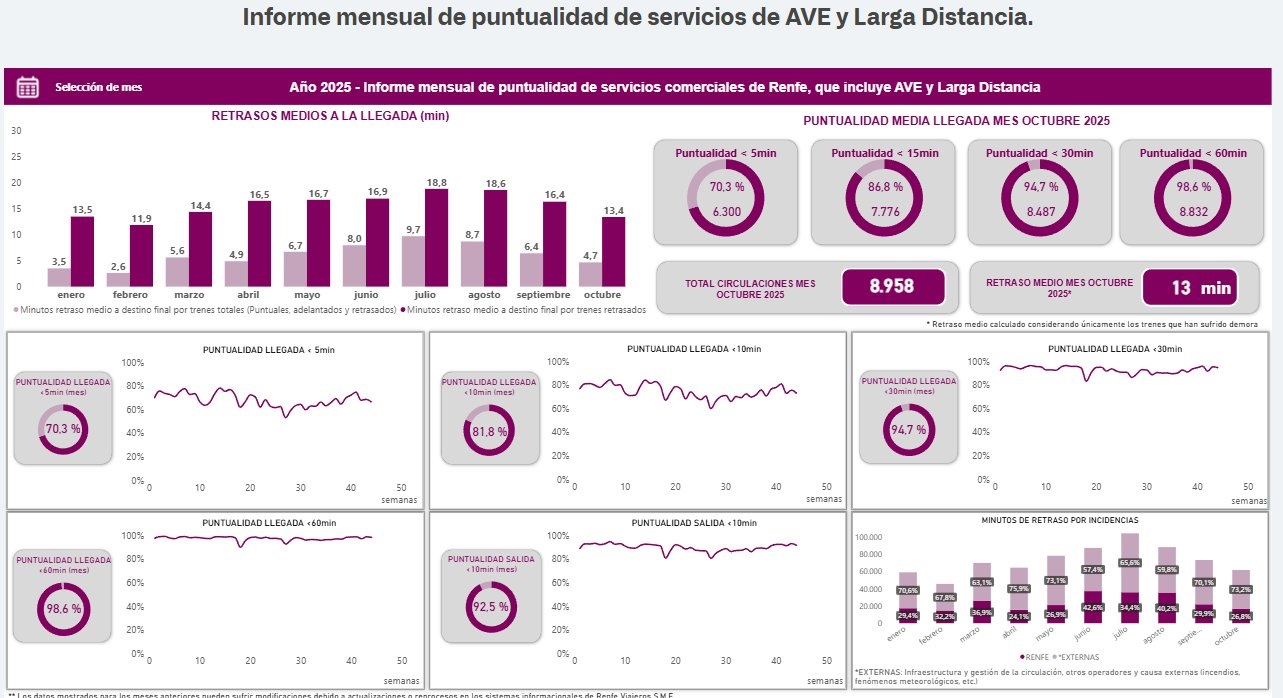
My goal is to process some of this data and display it in the tables or similar graphs that Renfe produces every month. (This one is in Spanish, but it shows, for example, the percentage of delays on high-speed trains).