Welcome to my Datascience
Data science is the practice of turning raw information into meaningful insights. It combines statistics, programming, and problem-solving skills to analyze large amounts of data. By using tools like machine learning and data visualization, data science helps organizations make smarter decisions, predict future trends, and improve the way things work. It plays a key role in fields such as business, healthcare, finance, and technology.
Fig 1.0 Data Science
Graphics play a very important role in data science because they allow us to understand and communicate information clearly. In data science, we often work with large amounts of data that are difficult to interpret just by looking at numbers in a table. Visualizing the data through charts, graphs and diagrams makes patterns more visible and easier to explain. Bar charts and column charts help compare quantities between different groups. Line charts show changes and trends over time. Pie charts display how a whole is divided among different categories. Scatter plots are used to see relationships between two variables. Infographics combine different graphics, icons and text in one layout, making the information more attractive and easier to understand for everyone. Good data visualization helps people make better decisions based on facts. It also makes presentations and reports more effective because the reader can quickly understand the message. Tools like Matplotlib, Seaborn, Excel, Tableau and Power BI are commonly used in data science to create these graphics. By choosing the right type of chart and presenting it clearly, data scientists can turn complex data into meaningful insights that anyone can understand.
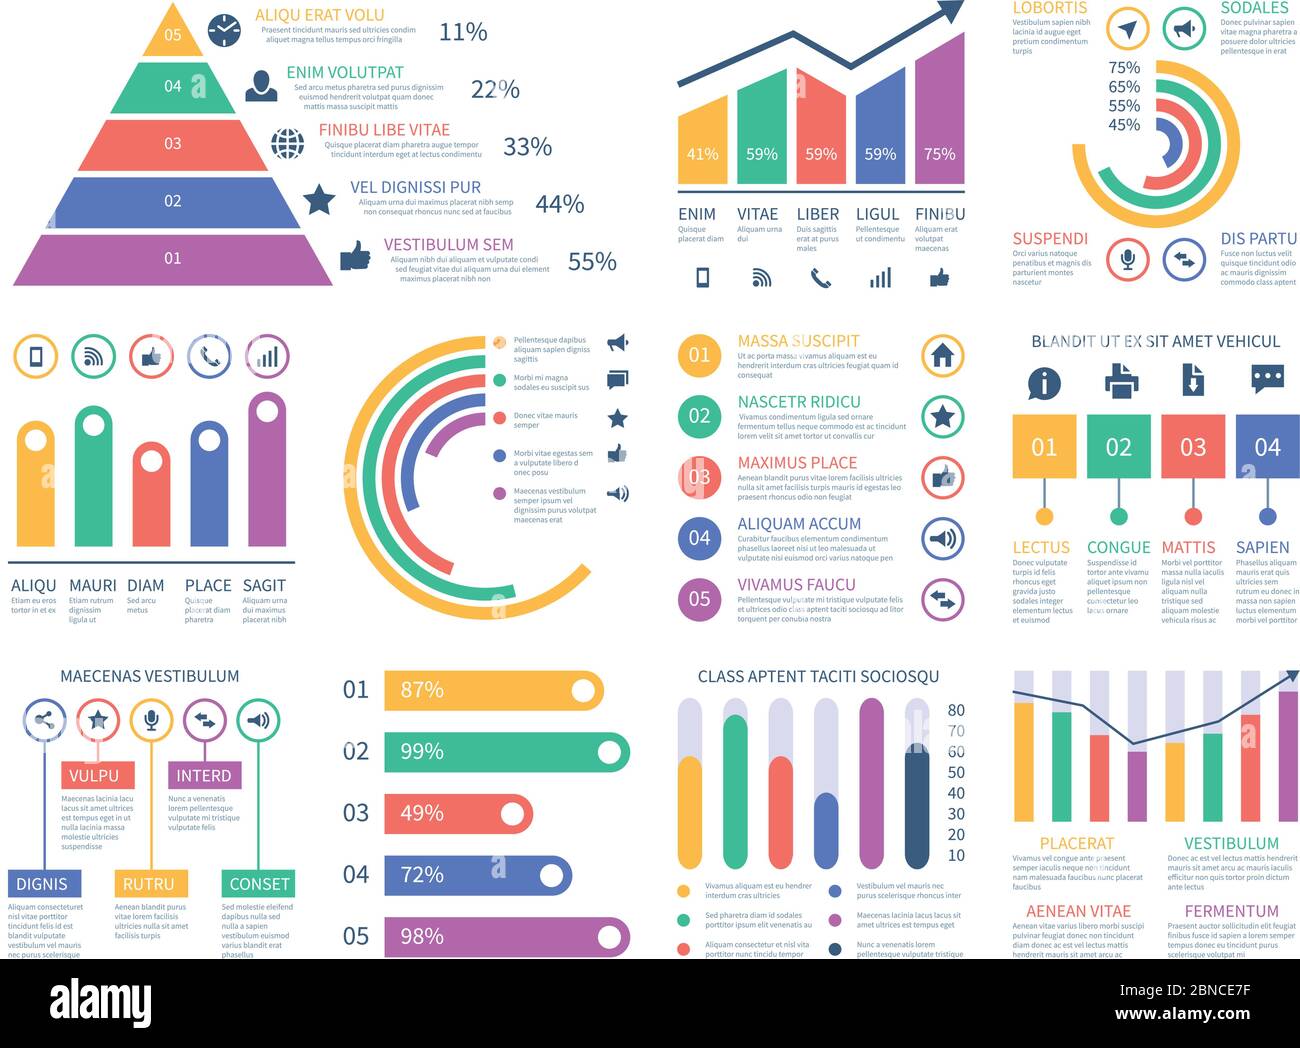
Fig 1.1 Data Science Graphs