< Home
Session4: Machine Learning 28/11/2025
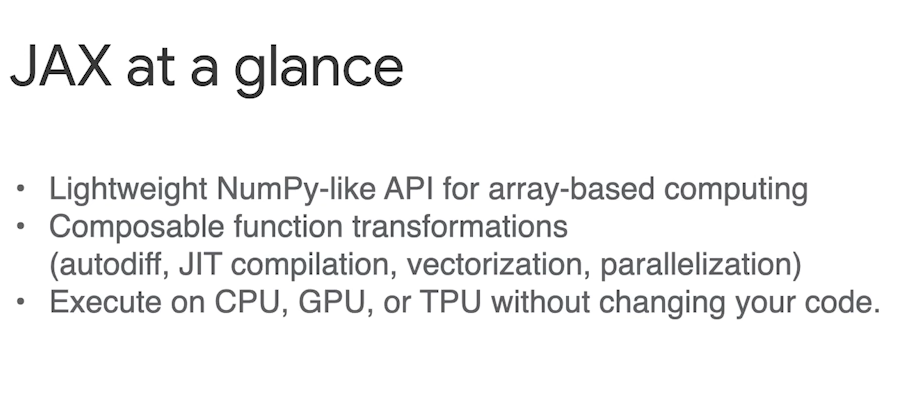
Jax
To my understanding, Jax is the python library package which will help to accelerate machine learning anaysis.
Understand
Basic NumPy-like operations
In [3]:
import jax.numpy as jnp

# create arrays
x = jnp.array([1, 2, 3])
y = jnp.array([4, 5, 6])

print("x + y =", x + y)
print("x * y =", x * y)
print("sin(x) =", jnp.sin(x))
x + y = [5 7 9]
x * y = [ 4 10 18]
sin(x) = [0.84147096 0.9092974  0.14112   ]
Automatic Differentiation (grad)
In [4]:
from jax import grad

# function: f(x) = x^2 + 3x
def f(x):
    return x**2 + 3*x

df_dx = grad(f)    # derivative of f

print(df_dx(5.0))
13.0
Gradient of multi-parameter function
In [5]:
import jax.numpy as jnp
from jax import grad

def g(x, y):
    return x**2 + y**3

dg_dx = grad(g, argnums=0)
dg_dy = grad(g, argnums=1)

print("dg/dx =", dg_dx(2.0, 3.0))
print("dg/dy =", dg_dy(2.0, 3.0))
dg/dx = 4.0
dg/dy = 27.0
Vectorization (vmap) – apply function to array automatically
In [6]:
from jax import vmap

def square(x):
    return x * x

# apply across array without writing loops
xs = jnp.arange(5)
v_square = vmap(square)

print(v_square(xs))
[ 0 1 4 9 16]
Assignment - Fitting a machine learning model to the data
- In my dataset I have youtube id which is string, in order to read, used pandas as (pandas.read_csv()).
In [7]:
import pandas as pd
import numpy as np
import jax
import jax.numpy as jnp
from jax import grad, jit
import matplotlib.pyplot as plt

# ===============================
# 1. Load the CSV correctly
# ===============================
df = pd.read_csv("datasets/youtube_video.csv")

print("Columns:", df.columns)
print(df.head())

# Identify numeric columns (ignore video id / text)
numeric_df = df.select_dtypes(include=[np.number])

print("\nNumeric columns detected:", numeric_df.columns)

# Convert to JAX arrays
data = jnp.array(numeric_df.values)

# If the file has only 2 numeric columns:
# x = first column, y = second column
x = data[:, 0]
y = data[:, 1]

print("\nLoaded numeric data successfully!")
print("x shape:", x.shape)
print("y shape:", y.shape)

# ===============================
# 2. Fit a simple linear model using JAX
# y = a*x + b
# ===============================

def predict(params, x):
    a, b = params
    return a * x + b

def loss(params, x, y):
    y_pred = predict(params, x)
    return jnp.mean((y - y_pred)**2)

grad_loss = grad(loss)

# Initialize parameters
params = jnp.array([0.1, 0.1])
learning_rate = 0.01

# Gradient descent
for step in range(500):
    grads = grad_loss(params, x, y)
    params = params - learning_rate * grads

a, b = params
print("\nLearned parameters:")
print("a =", float(a))
print("b =", float(b))

# ===============================
# 3. Plot the data + fitted line
# ===============================
plt.figure(figsize=(8,5))
plt.scatter(np.array(x), np.array(y), label="Data")
plt.plot(np.array(x), np.array(a*x+b), label="Fitted Line", linewidth=3)
plt.xlabel("X")
plt.ylabel("Y")
plt.title("Fit Using JAX")
plt.legend()
plt.show()

# ===============================
# 4. Print sample prediction
# ===============================
print("\nSample prediction:")
print("For x = 10 → predicted y =", float(predict(params, 10)))
Columns: Index(['video_id', 'title', 'channel_name', 'channel_id', 'view_count',
       'like_count', 'comment_count', 'published_date', 'thumbnail'],
      dtype='object')
      video_id                                              title  \
0  QwtOeDR-N3g  Why do Human Feet Wash up on This Beach? | Fas...
1  K0fw1uiSGE0  Range Rover SV (2025) - The King of the City, ...
2  StuKQpzfyjI  Bruce Wayne Becomes Batman - NEW Gotham City U...
3  C91854vbs8I            How the music of Mario Kart has evolved
4  1DaHVSmx160     My bulldog loves mess... you can see that ))))

           channel_name                channel_id  view_count  like_count  \
0    Fascinating Horror  UCFXad0mx4WxY1fXdbvtg0CQ       33955        1817
1                CAR TV  UCs_gcVRMHEx5mVXfQ7icQTg       59659        1130
2           Just4fun290  UCdPG86Ahrf9A8YzBnFDAaEg        8658          89
3      Thomas Game Docs  UCyy7dZhgfeMMctSoo3wDXlQ      161045        5391
4  Enzo English Bulldog  UCkk_2IfQ52OJcCUXOrJBtnw        7620          94

   comment_count        published_date  \
0            119  2025-10-03T09:15:02Z
1             22  2025-10-08T09:10:46Z
2              0  2025-10-04T15:00:06Z
3            239  2025-05-08T15:32:15Z
4             24  2021-08-12T15:33:31Z

                                          thumbnail
0  https://i.ytimg.com/vi/QwtOeDR-N3g/hqdefault.jpg
1  https://i.ytimg.com/vi/K0fw1uiSGE0/hqdefault.jpg
2  https://i.ytimg.com/vi/StuKQpzfyjI/hqdefault.jpg
3  https://i.ytimg.com/vi/C91854vbs8I/hqdefault.jpg
4  https://i.ytimg.com/vi/1DaHVSmx160/hqdefault.jpg

Numeric columns detected: Index(['view_count', 'like_count', 'comment_count'], dtype='object')

Loaded numeric data successfully!
x shape: (155669,)
y shape: (155669,)

Learned parameters:
a = nan
b = nan

Sample prediction:
For x = 10 → predicted y = nan