< Home
DataScience Session 6: Density Estimation
Synopsis
TBD
Assignment
- Fit a probability distribution to your data
A. Research ideas
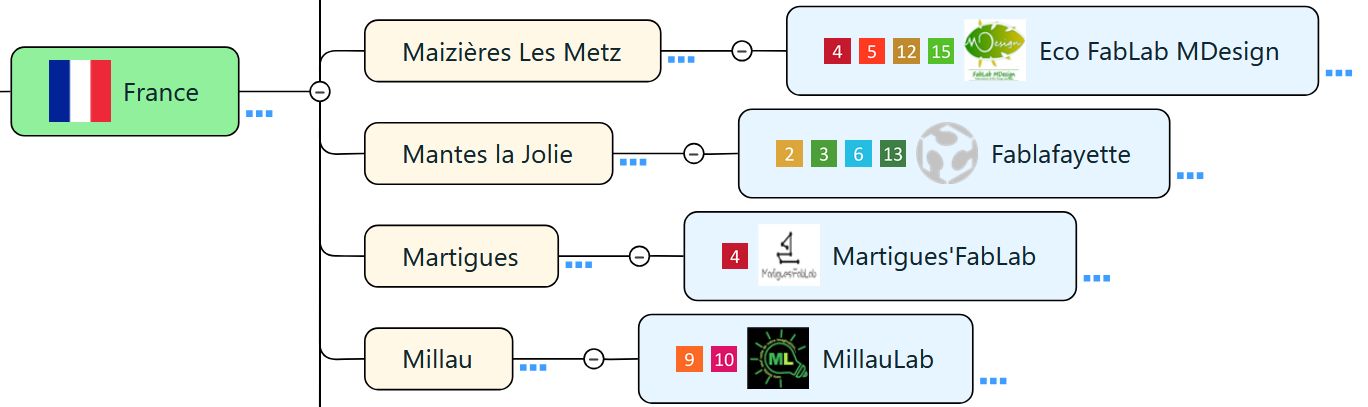
The purpose of this notebook is learning more from Fablab SDG data. 22% of all fablabs have prepared their so-called Fablab SDG Profile, ie a selection of max. 4 out of 17 UN Sustainable Development Goals that they consider as most appropriate for their lab.
As an example, the picture below shows a few profiles from France.
We constructed the following prompt:
ChatGPT prompt: (Original in Dutch, translated by https://translate.google.com): The Fablabs & SDGs WG has the SDG profiles of 570 fablabs (22%). These are selections of a maximum of 4 of the 17 SDGs that a fablab considers best suited to its own organization, e.g., SDG-04-08-09-17. We create a comprehensive overview and compile a monthly bar chart per country, continent, and worldwide showing the prevalence of the 17 SDGs in the profiles. We also sometimes produce lists of fablabs with identical profiles. I'm looking for other insights I could derive from these profiles, perhaps something related to graph theory?
Summary of ChatGPT Reponse:
🔍 Ideas for Deeper Insights
- SDG Co-occurrence Network
- Bipartite Network: Fablabs ↔ SDGs
- SDG Similarity Across Countries or Regions
- Profile Space and Clustering
- Time Dimension (if you have monthly updates)
- Expected vs. Surprising SDG Combinations
- Formal Graph-Theory Framework
Conclusion
ChatGPT suggested whole range of interesting ideas, roughly going from concrete to abstract. For the moment, we focus on the first.
B. Research planning and design
- Use the most recent Fab Network Data
- Follow the chatGPT suggestion to create a SDG Co-occurrence Network
# import python modules
import fabmodules as fm
import matplotlib.pyplot as plt
import networkx as nx
import numpy as np
import pandas as pd
from itertools import combinations
from collections import Counter
from matplotlib.patches import Patch
# set parameters
fm.output_path = output_path = "outputs/"

# set constants
sdg_colors = {
    1: "#E5243B",
    2: "#DDA63A",
    3: "#4C9F38",
    4: "#C5192D",
    5: "#FF3A21",
    6: "#26BDE2",
    7: "#FCC30B",
    8: "#A21942",
    9: "#FD6925",
    10: "#DD1367",
    11: "#FD9D24",
    12: "#BF8B2E",
    13: "#3F7E44",
    14: "#0A97D9",
    15: "#56C02B",
    16: "#00689D",
    17: "#19486A"
}

sdg_info = {
    "SDG-01": ("No poverty",                        "#E5243B"),
    "SDG-02": ("Zero hunger",                       "#DDA63A"),
    "SDG-03": ("Good health and well-being",        "#4C9F38"),
    "SDG-04": ("Quality education",                 "#C5192D"),
    "SDG-05": ("Gender equality",                   "#FF3A21"),
    "SDG-06": ("Clean water and sanitation",        "#26BDE2"),
    "SDG-07": ("Affordable and clean energy",       "#FCC30B"),
    "SDG-08": ("Decent work and economic growth",   "#A21942"),
    "SDG-09": ("Industry, innovation & infrastructure", "#FD6925"),
    "SDG-10": ("Reduced inequalities",              "#DD1367"),
    "SDG-11": ("Sustainable cities & communities",  "#FD9D24"),
    "SDG-12": ("Responsible consumption & production", "#BF8B2E"),
    "SDG-13": ("Climate action",                    "#3F7E44"),
    "SDG-14": ("Life below water",                  "#0A97D9"),
    "SDG-15": ("Life on land",                      "#56C02B"),
    "SDG-16": ("Peace, justice & strong institutions", "#00689D"),
    "SDG-17": ("Partnerships for the goals",        "#19486A"),
}
C. Data collection
# read_fabnetdata from local (/output) directory or from gitlab.fabcloud.org repository (/public)
# use fd.read_fabnetdata
# parameter 1: filename
# parameter 2: "local" directory
# parameter 2: default: "public"directory
fablabs, fabcities, countries, continents, retrieved = fm.read_fabnetdata("fabnetdata.xlsx")
url https://gitlab.fabcloud.org/fl-management/fablab-network-data/-/raw/main/public/fabnetdata.xlsx
fablabs  (2597, 29)
fabcities  (56, 7)
countries  (250, 44)
continents  (7, 35)
data retrieved 2025-12-01
D. Data processing
1. SDG Co-occurrence Network
ChatGPT:
- What: Build a network where each SDG is a node, and an edge connects two SDGs if they frequently appear together in fablab profiles.
- Why: Reveals which SDGs tend to “co-occur” — showing natural thematic clusters.
- How to analyze:
- Use edge weights based on co-occurrence frequency.
- Apply community detection (e.g., Louvain algorithm).
- Measure centrality (degree, betweenness) to see which SDGs act as bridges.
- Example insight: SDG 9 (Industry, Innovation & Infrastructure) may be a hub linked to SDG 4 (Education) and SDG 17 (Partnerships).
# ✅ 1. Extract SDGs from "SDG-04-08-09-17"

import re

def extract_sdgs(text):
    if not isinstance(text, str) or not text.startswith("SDG-"):
        return []

    # Extract exactly two-digit SDG codes between 01–17
    codes = re.findall(r"SDG-(\d{2}(?:-\d{2})*)", text)

    if not codes:
        return []

    # Take the FIRST matched block (e.g., "04-08-09-17")
    numbers = codes[0].split("-")

    # Convert to integers
    return [int(n) for n in numbers if 1 <= int(n) <= 17]

fablabs["sdgs"] = fablabs["profile"].apply(extract_sdgs)
# ✅ 2. Build SDG co-occurrence edges (unchanged)

edge_counter = Counter()

for sdg_list in fablabs["sdgs"]:
    if len(sdg_list) > 1:
        for a, b in combinations(sorted(sdg_list), 2):
            edge_counter[(a, b)] += 1

edge_df = pd.DataFrame(
    [(a, b, w) for (a,b), w in edge_counter.items()],
    columns=["sdg1", "sdg2", "weight"]
)
# ✅ 3. Build co-occurrence graph (unchanged)
G = nx.Graph()

for sdg in range(1, 18):
    G.add_node(sdg)

for _, row in edge_df.iterrows():
    G.add_edge(row["sdg1"], row["sdg2"], weight=row["weight"])
# ✅ 4. Compute network metrics (unchanged)

degree_centrality = nx.degree_centrality(G)
between_centrality = nx.betweenness_centrality(G, weight="weight")
strength = {n: sum(w["weight"] for _, _, w in G.edges(n, data=True)) for n in G.nodes()}

metrics = pd.DataFrame({
    "degree": degree_centrality,
    "betweenness": between_centrality,
    "strength": strength
}).sort_values("strength", ascending=False)

metrics
| degree | betweenness | strength | |
|---|---|---|---|
| 4 | 1.0000 | 0.000000 | 1274 |
| 9 | 1.0000 | 0.000000 | 1033 |
| 12 | 1.0000 | 0.000000 | 628 |
| 11 | 1.0000 | 0.000000 | 618 |
| 5 | 1.0000 | 0.000000 | 517 |
| 8 | 0.9375 | 0.011885 | 442 |
| 7 | 0.9375 | 0.000000 | 261 |
| 17 | 1.0000 | 0.000000 | 260 |
| 3 | 1.0000 | 0.005833 | 237 |
| 13 | 1.0000 | 0.000000 | 201 |
| 10 | 0.8125 | 0.012500 | 151 |
| 6 | 0.8750 | 0.101091 | 83 |
| 15 | 0.9375 | 0.108651 | 80 |
| 2 | 0.8750 | 0.150556 | 57 |
| 1 | 0.8125 | 0.348631 | 54 |
| 14 | 0.8125 | 0.167103 | 47 |
| 16 | 0.7500 | 0.335992 | 41 |
# Add color
for sdg, color in sdg_colors.items():
    if sdg in G.nodes():
        G.nodes[sdg]["viz"] = {"color": {
            "r": int(color[1:3], 16),
            "g": int(color[3:5], 16),
            "b": int(color[5:7], 16)
        }}

# Export
nx.write_gexf(G, output_path+"sdg_network.gexf")
E. Data Study and Analysis
# (Assumes you've already built G as before)
pos = nx.spring_layout(G, weight="weight", seed=42)

plt.figure(figsize=(10,10))
plt.title(f"World: Fablab SDG Profiles:\nSDG Co-occurrence Network\n(data retrieved: {retrieved})")

# Draw edges
weights = [G[u][v]["weight"] for u,v in G.edges()]
nx.draw_networkx_edges(G, pos,
                       width=[w*0.2 for w in weights],
                       alpha=0.5)

# Draw nodes, using SDG colours
node_colors = [sdg_colors.get(node, "#888888") for node in G.nodes()]
nx.draw_networkx_nodes(G, pos, node_size=800,
                       node_color=node_colors)

# Labels
nx.draw_networkx_labels(G, pos, font_size=12)

#plt.axis("off")

from matplotlib.patches import Patch

legend_handles = [
    Patch(
        facecolor=color,
        edgecolor="black",
        label=f"{sdg}: {label}"
    )
    for sdg, (label, color) in sdg_info.items()
]

#plt.legend(handles=legend_elements, title="SDGs", bbox_to_anchor=(1.05, 1), loc="upper left")
plt.savefig(output_path+"sdg_network.png")
plt.show()

Conclusion
The graph shows:
- a strong co-occurrence for five SDGs: 04, 05, 09, 11, 12;
- a lesser co-occurrence for 03, 07, 08, 10, 17;
- least co-occurrence for 01, 02, 06, 13, 14, 15, 16.
Is this different from what we could expect from the bar chart we produce every month? The next graph shows the prevalence for the 17 SDGs of fablabs in France.
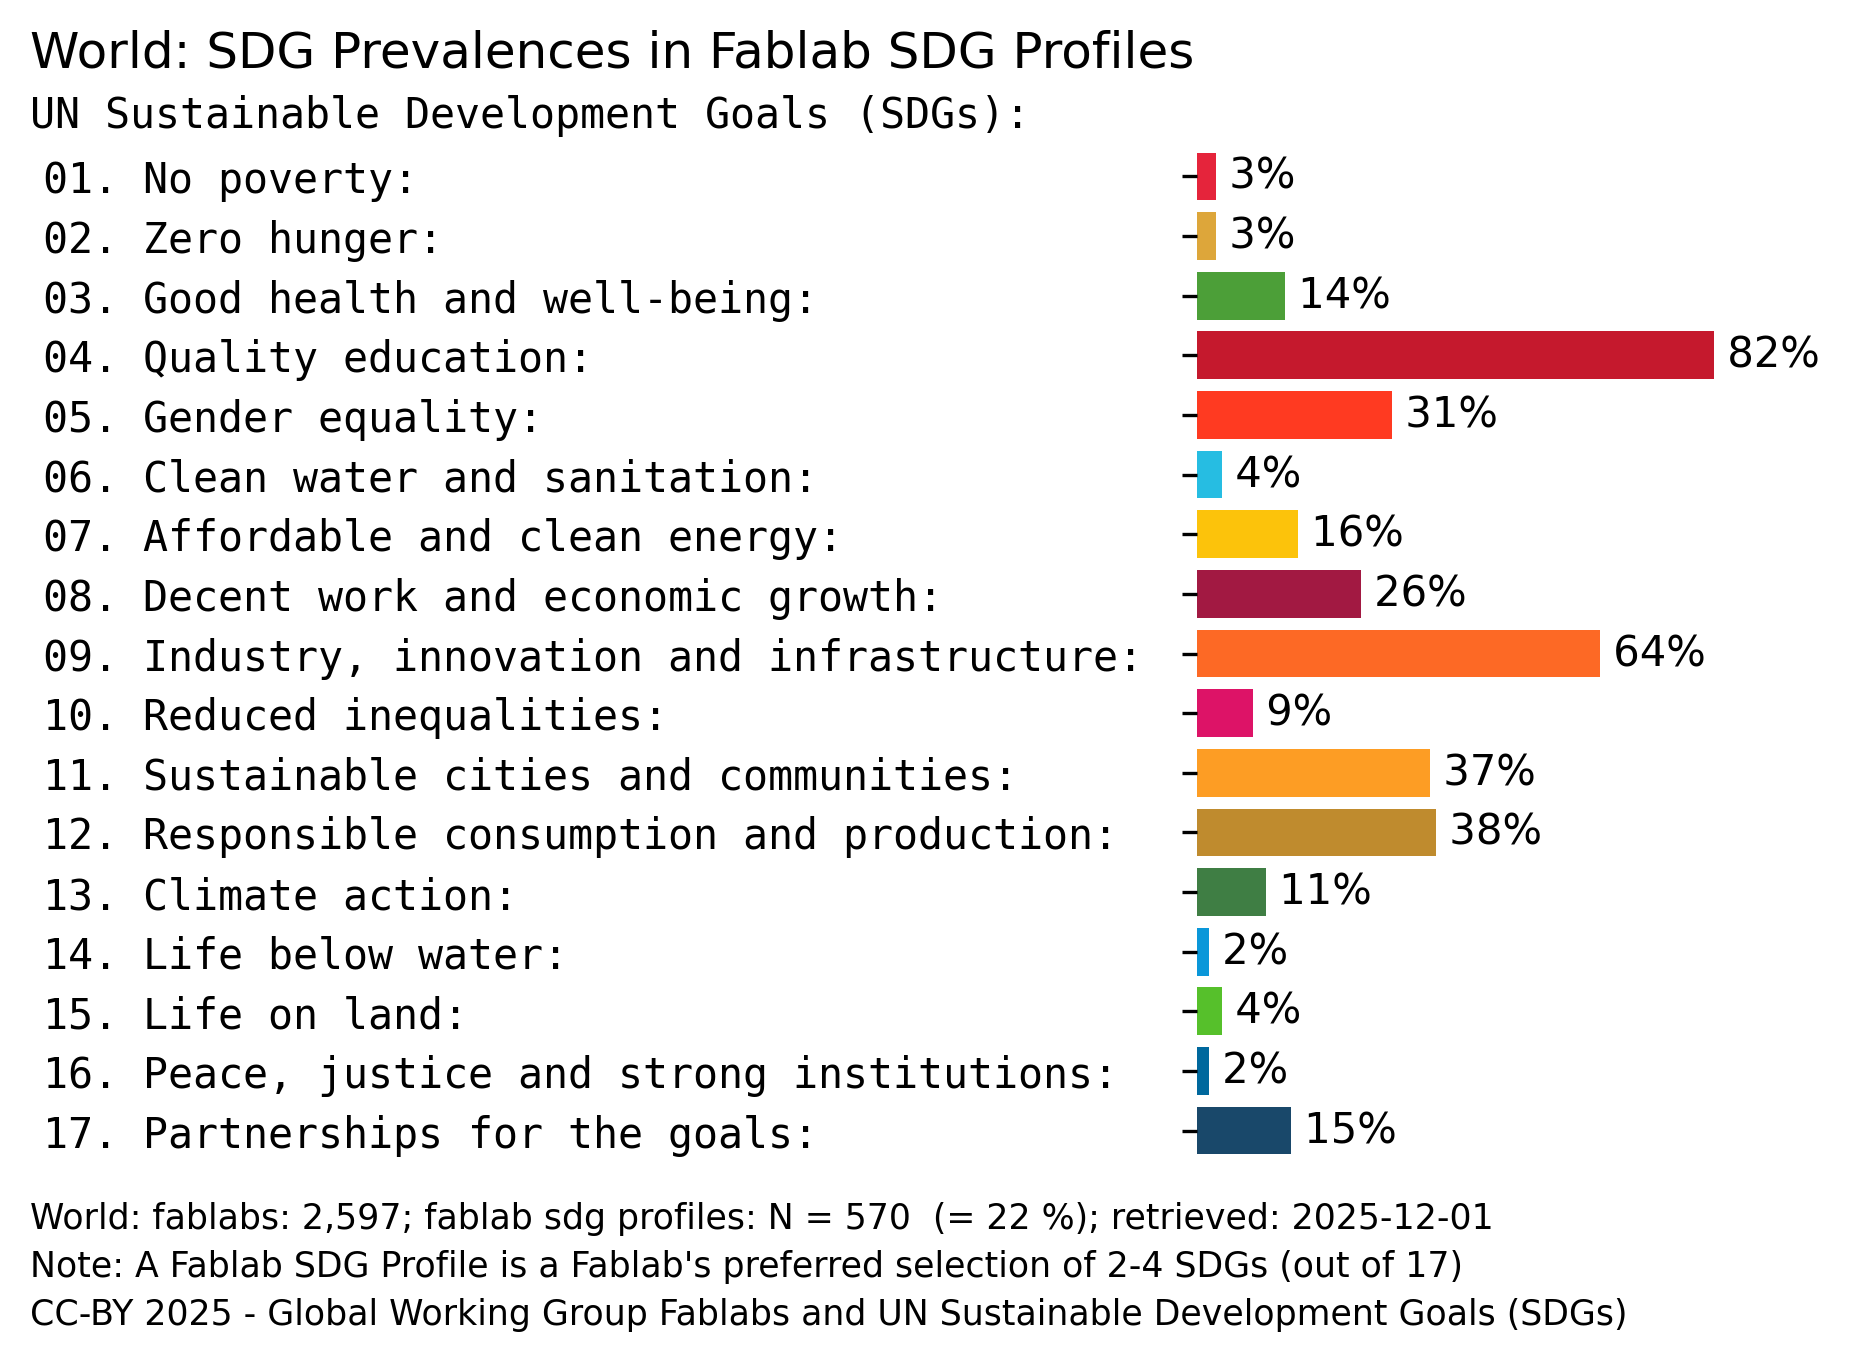
If we divide our prevalence percentages in three groups: high, medium, low, the SDGs involved are more-or-lessthe same as in the co-occurrence division of strong, lesser, least. It is understandable as the higer the prevalence, the higher the number of connections with other goals (and vice versa). Nevertheless, it would be interesting to generate these co-occurrence graphs for separate continents (or other country groups). Maybe in some cases there are two "cliques" of goals?
F. Data Publishing and Access
G. Data Preservation
H. Data Re-use
Evaluation and Follow-up
- The resulting map for the whole world is not very striking yet; it could be if we generate such a map for separate country groupings, like continents.
- From programming point of view: better remove the lists of constants (sdg_colors and sdg_info also can be trieved from an existing dataset).
Follow-up
- Try co-occurrence networks for continents (or other country groupings).
- Try the other ChatGPT suggestions: 2. Bipartite Network: Fablabs ↔ SDGs 3. SDG Similarity Across Countries or Regions 4. Profile Space and Clustering 5. Time Dimension (if you have monthly updates) 6. Expected vs. Surprising SDG Combinations 7. Formal Graph-Theory Framework
Review