< Home
Class 1: What means data science
Os this first class Neil introduced us in the world of data science, explaining how understanding data and giving them interpretation could make a terrible difference in differents areas of life, from the history of a cholera spread in London to the discovering the Higgs Bosson as a very little deviation of an expected graphic of data.
So our goal this first class y to understand the varaity of uses that the data can have in our days. Right now everybody is collecting data from our surroundings, online services, goverments and private companies. And some of them are available for the people...but we dont know what to do with them.
Having this data and make something with them is the goal of this course, learning the tools and resources to deal with them. So, lets start!!!!
Choosing a Dataset
The assignment for this week is to choose a dataset to work with. There are many webs with dataset available to download and use with the tools we are going to see in the nex classes. At the bottom of the class webpage you can find links to this websites, so lets search for a interesting dataset for me.
Spain Goverment database
The spanish govermet has a portal dedicated to the databases that are accesible to anyone. The website is:
Acces the Database website from the Goverment of Spain
In this website you can filter by many items. I try to make a search about the noise in the streets, something that its anoying for me....and im not livin in the best country for this XD Making a search for "noise" give some result, but nothing interesting (try to find some local data from my city)
Then y try to follow links in the website, just to see if something catch my attention, and i found a database related about tourism (the main economy in the country) and access point to our country. So i download it (json format)
Travelers entering country, with tourist points and from which country they come from
So i download the JSON file from this statistic.
An example of how data can help
Apart from the examples of data visualization that Neil show us during the class, i remember a nice history i read in the internet some years ago. Abraham Wald was an Hungarian and American matematician and statistical. During the WWII he was a member of the Statistical Research Group (SRG) in Columbia University. The problem is that the SRG worked in knowing how the planes can be better on the combat, estudying the best processes and how to reinforce the plane in specific places.
They tracked all the damage that a plane come back to the base has a damage. So they put a red dot where the plane has some damage, to reinforce this part, hoping that this reinforcement give the planes more resistance to attacks. Lets see the visual reflecting the most of impacts:
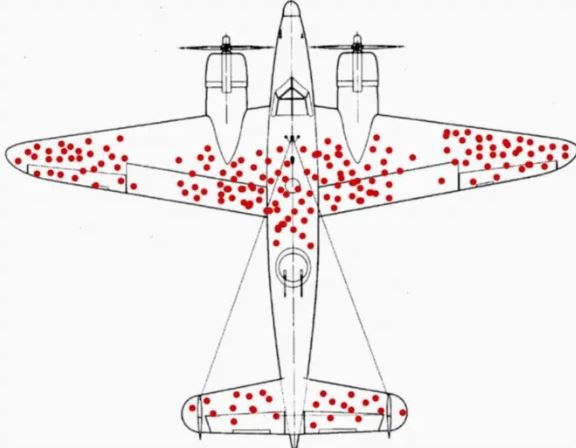
So all the work goes to reinforce the red dots parts, but Abraham Wald realize that the part sof the planes that hasnt any dot, like the motors or the turret in the back, was the parts that need more reinforcement....¿why? Because the absence of data means that the planes that dont come back was the one that was derribated in the battle.
So visualizations of data could give you more information than just watch the data in detail.
Sometimes data dont show the true, but show where to look.
The enviroment: Jupyter
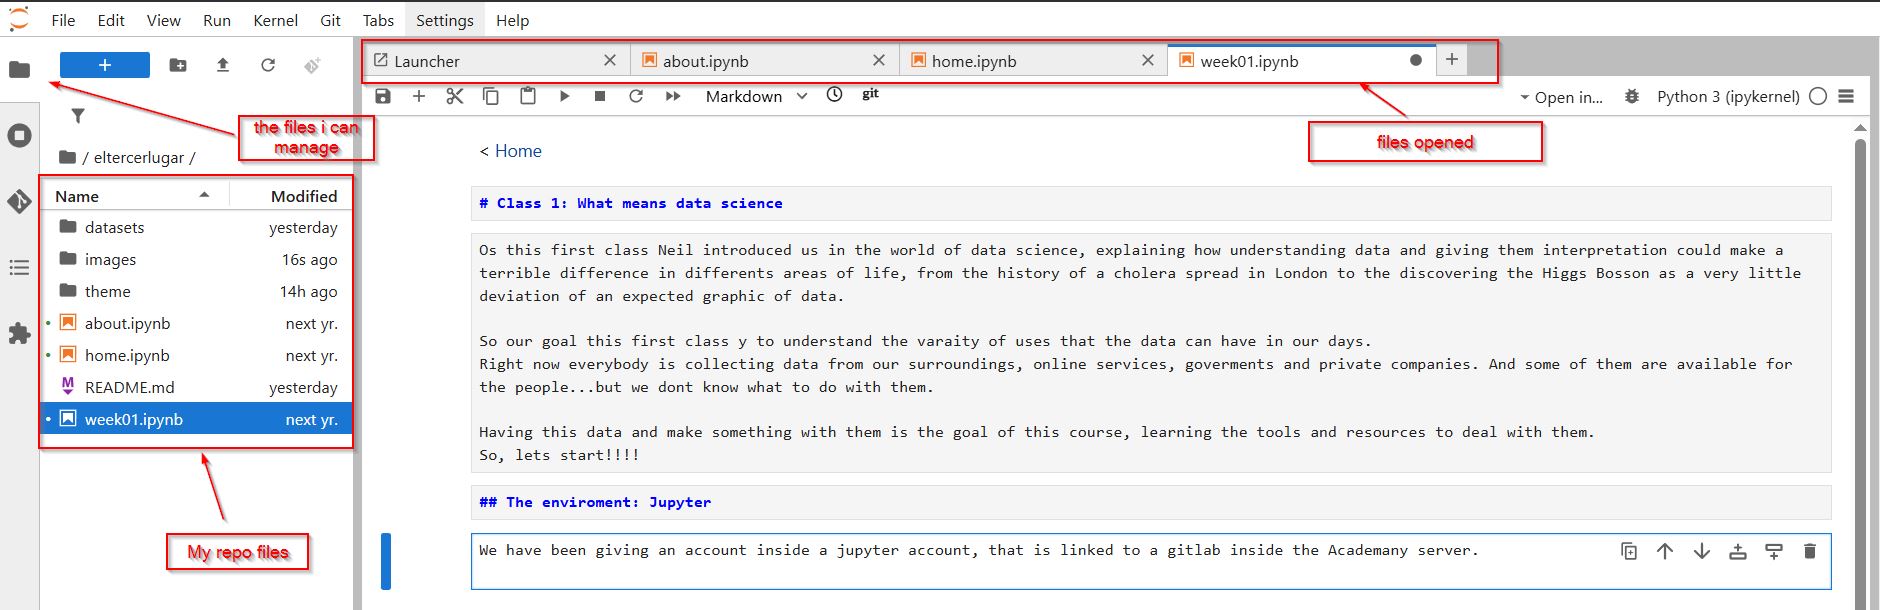
We have been giving an account inside a jupyter account, that is linked to a gitlab inside the Academany server. Is a different approach if you come from git or gitlab. Everything you add to a jupyter file needs to be "executed", even the text. So here is the workflow for editing a block inside Jupyter:
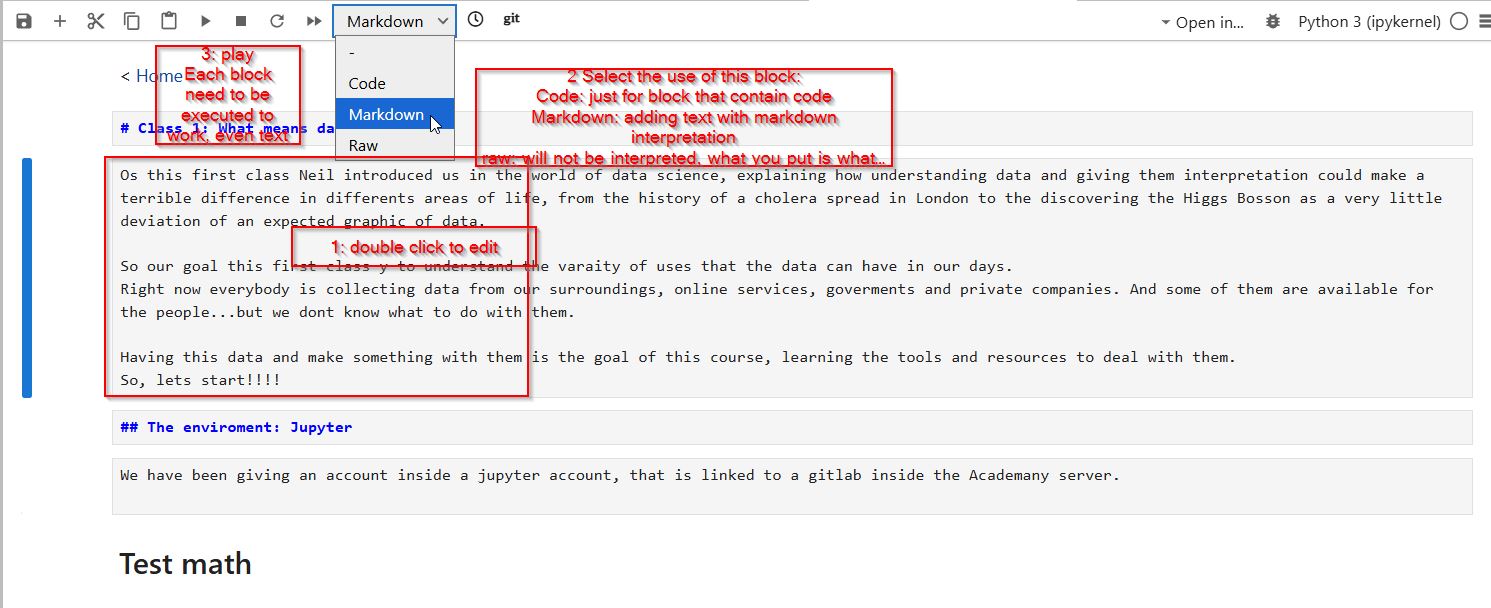
Its crucial that, if you want to insert text inside the jupyter, select the dropdown menu in the up and choose "markdown". And then , press play to the block.
Adding a photo
To add a photo you can use the markdown code for adding it. and after or before do that you need to upload to the images folder of your jupyter.
And dont forguet to press play on this block, and adding the image to the correspondent folder on the left panel of jupyter
Updating changes to the git repository
Once you made some changes in the jupyter files, and you want to be public in your repo in gitlab, here are the steps you need to do:
On the left panel of Jupyter, click on the Gitlab extension. There you will see the control panel of the files related with your public gitlab associated with Jupyter.
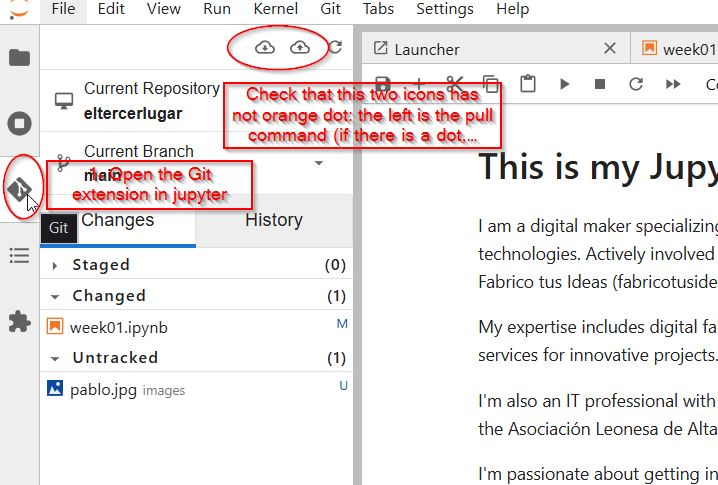
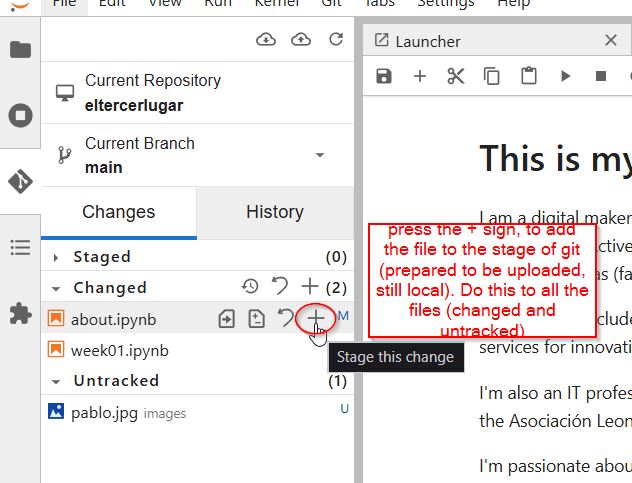
The files that you have changed will be listed in the "Changed" section (those files that already existed in your repo, and you have changed it) and in the "Untracked" section (those files that DONT existed in your repo, and you have upload from your computer)
Now you need to add this files (changed and untracked) to be staged (like ready to be uplaoded)
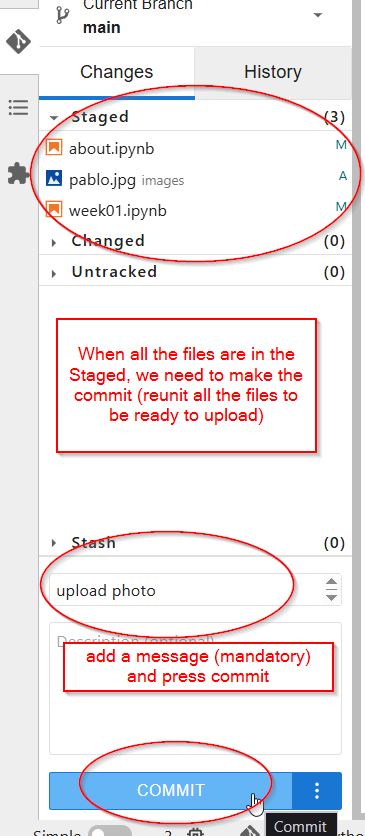
When all the files you want to upload to your webpage are in the Staged section, you need to make a commit. A commit is like making a zip with all this files to upload to your website. Its mandatory to add a comment, and then press COMMIT
Check that you see this message in the bottom right of Jupyter. If not (an error message appears) maybe there are some miscongruence between whats online and what you have.
And when the commit is ready, to be able to see the changes in your webpage online, you need to make a git push of the commit. So press the button of a cloud with an up arrow in the top of the git extension.
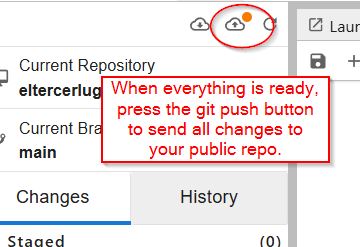
Now you will be able to see all the canges in your online repo, so you will be able to see all the changes in your website.
Changing your name in the main page
To change your name in the top of your website (that says [Your-Name-Here] - Fab Futures - Data Science) you need to go to the theme folder, where is all the files related with the style of your website Open the file /theme/index.html.j2 and find the line that says "div class="title" Now you can change the text in between the
You can also change things like the colour of the text, sizes, alignment, how big images are...changing the file style.css In internet you can find several tutorials to change a CSS file to make your website look better.
Changing the theme: style.css
The file where you can change the colors, font, text size and some other formating for the website its inside the "theme" folder, and its called style.css. Here are the thing i have changed:
.navbar {
background: #4e3dd8; /changed by me, change the color of the top bar in the website/
color: white;
padding: 10px 20px;
}
.title {
display: inline;
font-size: 2em;
font-family: Verdana; /added by me, change the font of the title to verdana/
}
.navbar-link {
color: white;
margin-right: 15px;
line-height: 2em;
font-weight: bold; /*added by me, makes the link with bold style*/}
Links that can be useful
Markdown basic syntax: Basic syntax of Markdown.
Understanding CSS: CSS Intro